Big Data’s Impact On Your Bottom Line

Big Data’s Impact On Your Bottom Line

When senior care facilities leverage big data, overcoming resource shortages and streamlining everyday operations becomes possible. Big data is essentially large and diverse sets of data that have analytical value. Senior living providers use several software sources to operate their businesses – tying these together yields insight to a wealth of opportunities to improve upon overall financial performance. According to a Statista report, the market for health-related analytics services using big data will increase to $13 billion by 2025.

Prone 2 Dream delivers big data analytics by integrating the various critical software programs you rely on for your business operations. With accurate, dynamic, real time reports, analytical insights promote more informed decisions that will benefit your company with improved financial performance.

This article highlights the benefits of big data analytics for enriching operations in senior care facilities today.


Circumvents staffing challenges

It’s no secret that the pandemic placed additional pressure on an already tenuous staffing situation in senior living. In fact a New York Times feature explains that staffing shortages account for an estimate of 342,000 job losses since 2020. This reality impeded daily operations at almost all senior care facilities. With big data, however, providers can analyze their timeclock, payroll, and agency labor to deploy strategies for improvement. Using big data analytics, administrators can identify inefficiencies and subsequently manage them.


Prevents compliance gaps

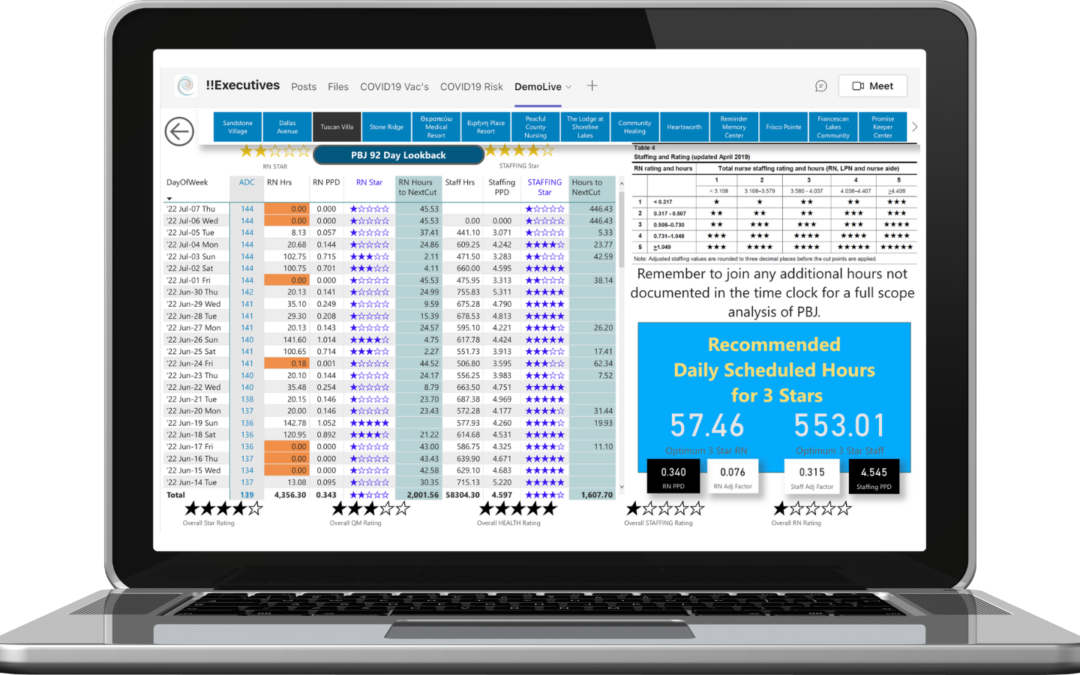
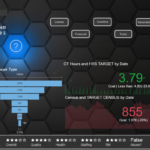
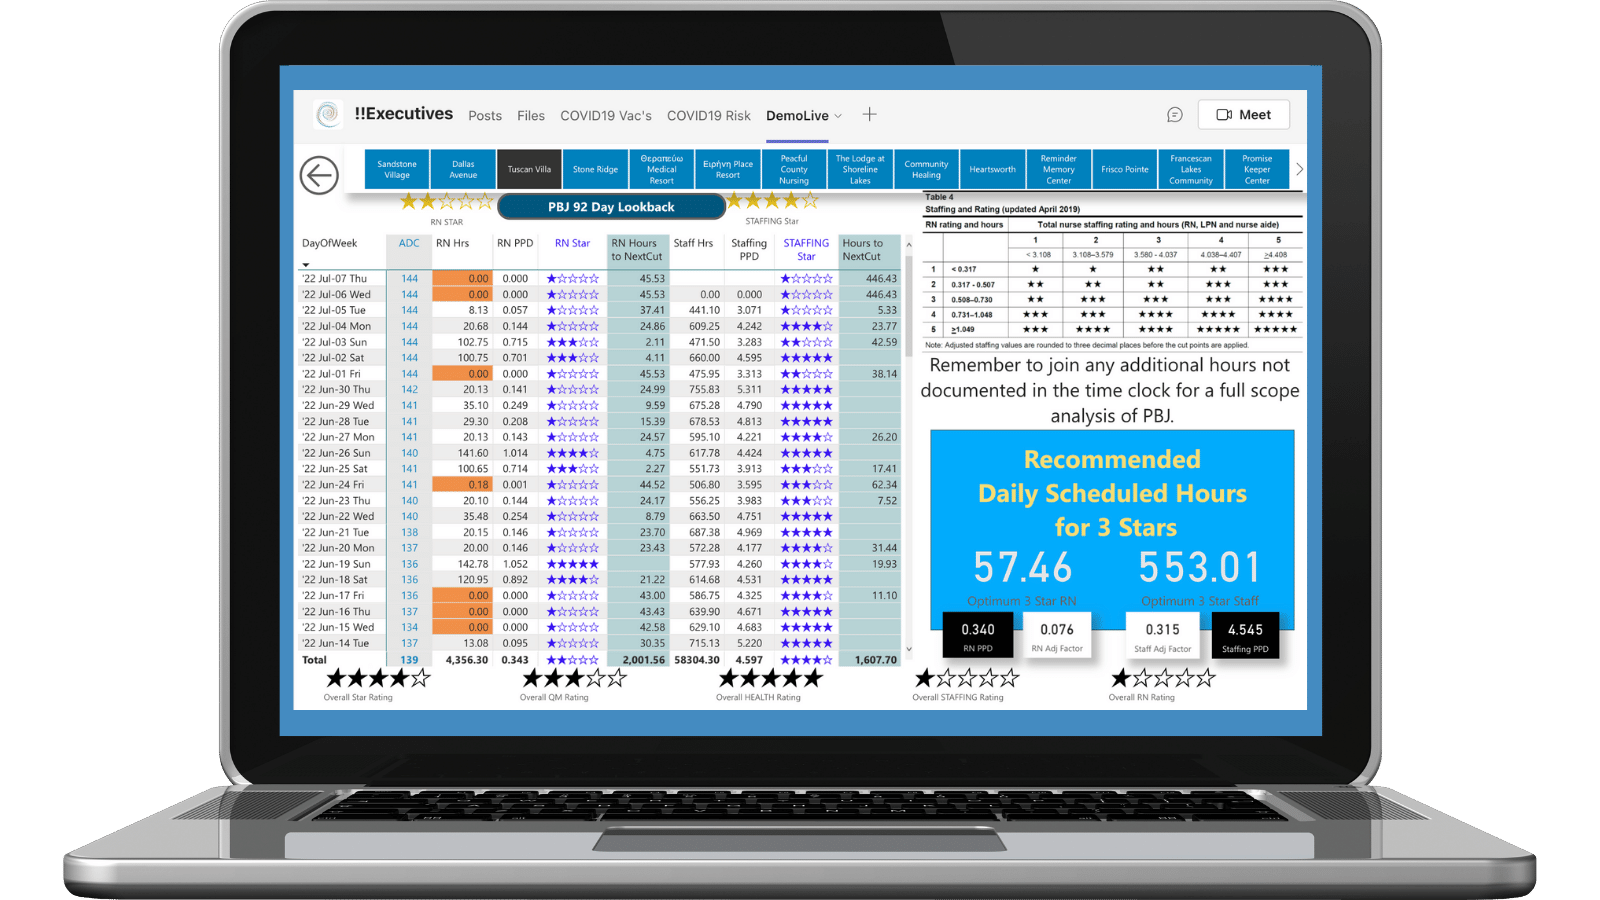
Big data enables applications that help providers comply with federal and state regulations, especially those related to their facility’s staffing levels. Administrators can enlist our DreamCore Intelligence Center to reveal compliance gaps such as RN shortages. This technology also makes recommendations on how to address and fulfill reporting requirements. Ultimately, senior care services can avoid incurring penalties or sanctions when they don’t meet staffing standards.

DreamCORE Intelligence Center

Offers accurate and customized daily reports

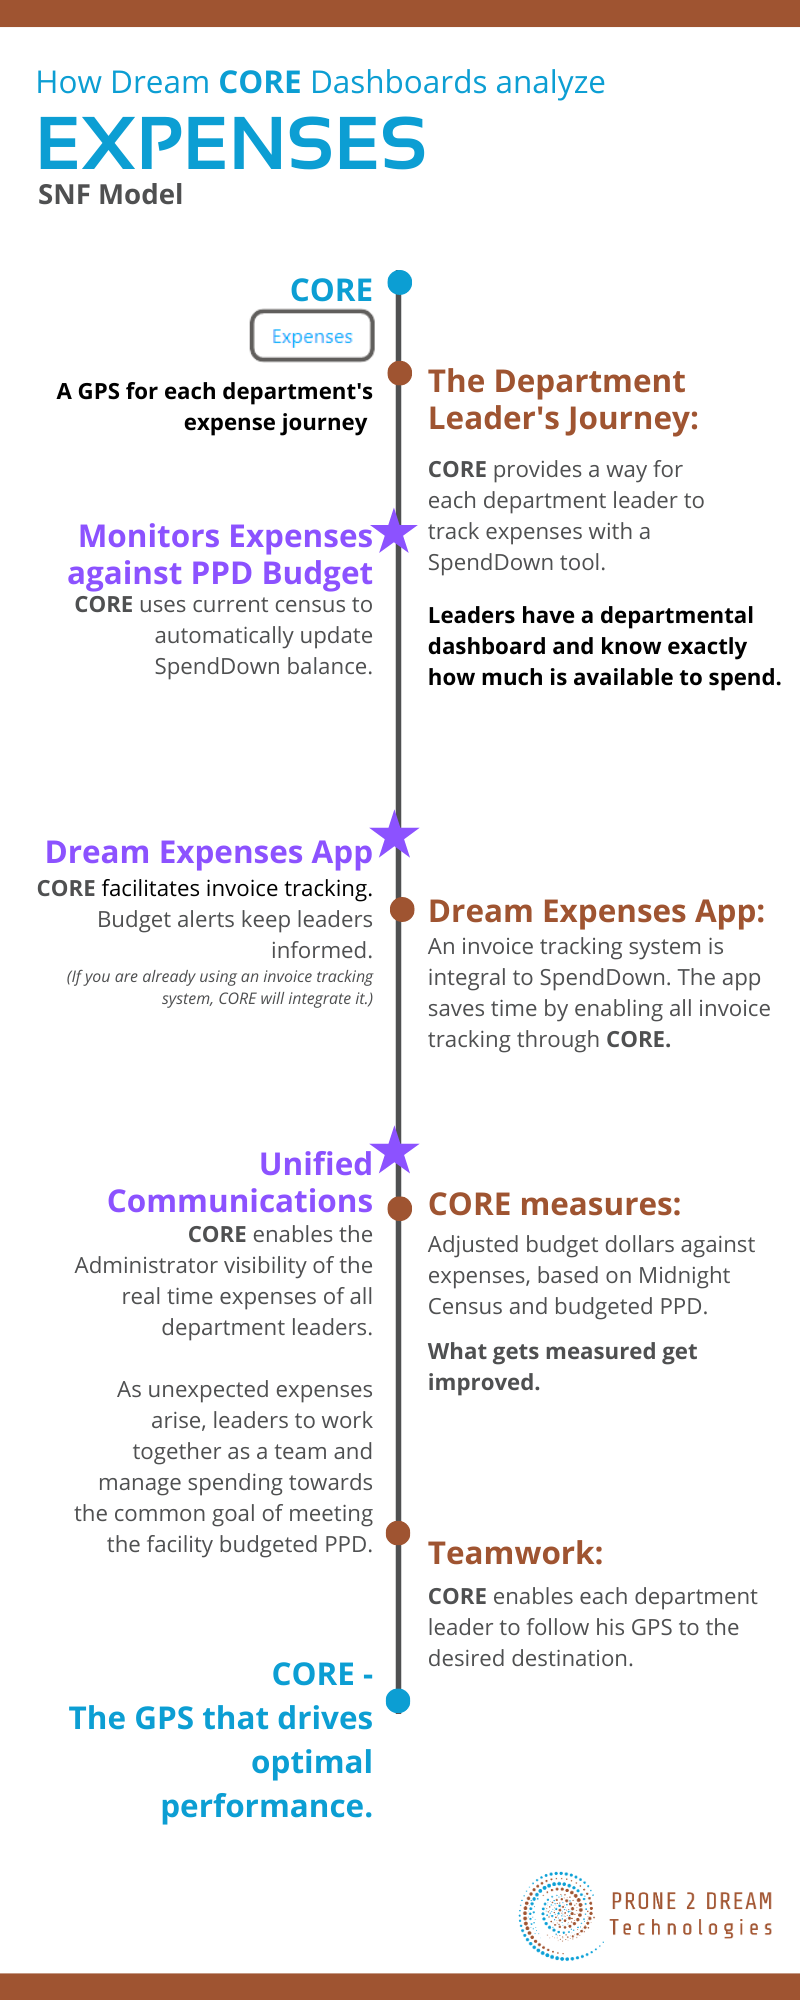
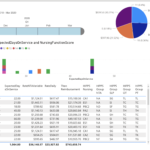
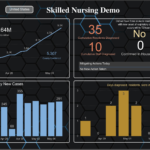
When senior care providers’ processes are optimized by data, normal human errors that come from misrepresented information can be avoided. Our DreamCORE Intelligence Center integrates your data sources and delivers accurate reports through robotic automated processes. As such, information displayed on the dashboards provides both historical and prospective pictures enriching financial strategies. For instance, our declining budgets feature calculates daily adjustments to SpendDown based on current client base (census). In our post ‘Changing Minds Changes Habits’, we mentioned how DreamCORE Intelligence connects all your frontline managers to daily adjusted budgets. This means overspending becomes an active choice, instead of human error. Your frontline leaders want to succeed in their roles – provide them the tool, DreamCORE, to do so.


Promotes faster, evidence-based decisions

Comprehensive financial strategies are crucial in achieving a profitable bottom line in senior care facilities. With the right financial data, managers at every level are empowered to allocate appropriate funds for all their department’s needs. Utilizing DreamCORE bolsters faster, evidence-based decision-making. Do all your leaders have the right data to improve their financial performance and accountability?

As seen in Maryville University’s post on assisted living, America’s population of seniors is large and growing. According to the U.S. Census, there are 47 million seniors age 65 and older in the United States; the Population Reference Bureau expects this number to double to more than 100 million by 2060.

The value of big data to the senior living industry covers a broad scope, from the financial benefits outlined in this article to clinical advances which we’ll address in a future post. For more insights on how big data can positively impact your company, stay tuned to our latest articles on Prone 2 Dream.

If you’d like to learn more about leveraging big data to enhance operations for your senior living centers, contact us for a consultation or a demo.

3 Tips for Successful PBJ Submissions

3 Tips for Successful PBJ Submissions

Does submitting an accurate and thorough quarterly PBJ create stress for the entire team?

Here are the top 3 factors that adversely impact your staffing star ratings:

  1. RN <8 hours – Four or more occurrences in the quarter with no RN staffing 8 consecutive hours, results in your facility receiving an automatic one-star rating for RN staffing & overall staffing. It is critical that all hours are accounted for, including agency.
  2. Break time – Be aware that CMS mandates a 30-minute deduction of time in the PBJ calculation for every 8-hour shift worked. CMS will automatically deduct 30-minutes for every shift greater than 8-hours if not demonstrated within your submission report – Resulting in fewer hours than you predicted. Unfortunately, this impacted a client of ours, causing a loss of nearly 20,000 hours during the 3-month period!
  3. MDS Discharge Assessments – Many facilities have not completed all their MDS Discharge Assessment forms for the quarter, causing an inflated CMS Census that is used in your PBJ staffing calculations – Ultimately leading to a lower NHPPD than predicted and most likely leading to a negative score outcome. Prioritize completion of MDS Discharge Assessments and your actual census will mirror CMS’s census.

The organizations’ expertise is on resident care – understandably, thus they find the data entry and technical elements of PBJ frustrating, leading to procrastination with less than satisfactory staffing stars. DreamCORE Intelligence Center is your team’s solution to PBJ management and submission.

The DreamCORE Intelligence Center leverages technology so that you and your organization can put the resources and focus back on resident care. Our technology generates alerts on a daily basis allowing for timely adjustments so your next PBJ report can be accurate.

In addition, we can assist you with:

  • Organizing all your PBJ data
  • On-time report submissions
  • Audits – scrub, organize, prepare data for response

CMS has new guidelines effective as of 10/1/2022, including weekend staffing and staff turnover measures. We can help you prepare for these important changes.

Schedule a demo today.

3 Ways to Manage Staffing Data in Today’s Challenging Climate

3 Ways to Manage Staffing Data in Today’s Challenging Climate

3 Ways to Manage Staffing Data in Today’s Challenging Climate


We understand. Thanks to 18 months of a pandemic, there’s a widespread industry shortage of staff. Compound that with an impending federal vaccine mandate. Looming in the background, a federal minimum wage hike.


Yet the need for senior care services is higher than ever. Stringent infection control protocols and new procedures add to the operational complexity you’re navigating every day.


You’re trying to hold on to those who are the foundation of your operation by incentivizing loyal staff with overtime, bonuses, and wage increases. You’re adding agency staff to fill the gaps. These strategies are necessary to stay in PBJ compliance.

So how do you manage all this when the goal post is constantly moving?


One way is to laser focus on your data – and ensure consistency with your data collection, data representation, and data interpretation. Though you currently have tons of data, is it accessible in a relevant, actionable format? If you find yourself shuffling paper reports or clicking through multiple browser windows to find the information you seek, we can offer you a much better way.


By integrating your legacy software platforms into a user-friendly, drillable dashboard, Prone 2 Dream customizes how you view your payroll expense, timeclock data, agency expense, and even PBJ star status. You have actionable insight, all in one place, that you can decipher in moments. You can know what you need to know, and make decisions that positively impact your company’s profitability.

Labor Distribution Report

Here are 3 ways we can help you manage staffing data:


DreamCORE Dashboards are a prospective approach to managing profitability. We integrate your data silos to present green views of actionable KPIs. DreamCORE customizes reporting solutions by bringing the relevant data from the various sources together. Watch your P&L building throughout the month – Earnings Reports, Wage Analysis, Labor Distribution, Census, Reimbursement rates, Spend Down (Checkbooking) and Industry KPI’s such as HPPD, DollarsPPD, Overtime expenses…and much more.


The results? Data you can use – to zero in on your daily activities, find issues, course-correct, and meet your projected outcomes. (DreamCORE Dashboards are a comprehensive solution that include the 2 solutions below – Agency Time Tracker and DreamPBJ Dashboards.)


Not ready for the entire financial package? Start with one of these staffing-specific solutions:


Agency TimeTracker is a user-friendly app that enables the contractor to clock in and out at the facility. The data integrates with your in-house timekeeping system to provide an accurate daily staffing review. You have a true picture of your staffing hours for PBJ reporting and invoice management. At the end of the quarter, simply export your Agency XML file for easy CMS – PBJ reporting.


DreamPBJ Dashboards is a business intelligence solution that provides 92 day rolling tracking of your regulatory compliance data with visibility into your PBJ daily star rating. Continuity brings stability, and ultimately enables you to know what each quarter’s stars will be when you cross the last day of the quarter. Dream PBJ takes the mystery out of PBJ reporting.


We welcome the opportunity to discuss your unique challenges. We’ll help you wrangle all your data so it makes sense … while you’re running the race.

Choose a convenient time on our calendar by clicking here.

Or simply call: (469) 294-5233 or email: contact@prone2dream.com.

Senior Living Operators – Will You Meet Your Budget This Month?

Senior Living Operators – Will You Meet Your Budget This Month?

There’s a nagging question in the minds of senior living administrators and department managers everywhere: “Will I meet my budget this month?”


DreamCORE Dashboards and the Dream Expenses App are the practical solution to this notorious problem – How to manage expenses with a census that fluctuates daily and a labyrinth of operational issues.


Dream Expenses is a simple, mobile app that inputs each invoice directly into your general ledger – “one-touch invoicing”. Easily select the GL code, and easily split the invoice if necessary, even between departments.


This practical checkbooking system updates your DreamCORE Dashboards with every entry. You have near real time access to department budgets that are auto-adjusting by SpendDown and fluctuating census.


The result: DreamCORE Dashboards take the guesswork out of meeting the budget. Each department leader has a departmental dashboard and knows exactly how much is available to spend.


DreamCORE Dashboards solve the problem of managing expenses against a fluctuating census, saving time and enabling confident, evidence-based decisions.


Book a live demo – Grab a spot on our calendar here.


Contact us today to see how easily you can manage your expenses and make data-driven decisions, when all your critical data is in one place.


Infographic SNF Expenses

5 Tips for Agile Budget Planning

5 Tips for Agile Budget Planning

5 Tips for Agile Budget Planning

It’s budget planning season, the time of year organizations evaluate the past year and conceive a plan for successfully moving forward. It can be daunting, especially as a global pandemic continues. For skilled nursing and senior living operators, planning next year’s budget requires careful scrutiny, knowing that the effects of COVID-19 are still a threat, and wondering how to plan for the unknowns.


Many lessons have been learned over the past 18 months. Traditional “business-as-usual” budgeting strategies and processes need a new approach. Corporate financial leaders know that they need the ability to react and reforecast with speed and accuracy – on an ongoing basis. The agility to match resources with strategy over time can only be achieved with a system of green data. The knowledge of where your P&L stands at any moment in time is essential to making evidence-based decisions to keep the company on course.


The 12-Month Budget


Amid ongoing, unprecedented uncertainty, a detailed long term budget may seem like a futile exercise. Yet, the need for speed, visibility, and cost control remains. Budget planning becomes a balancing act of business strategy and resource allocation.


DreamCORE Dashboards are the tool to reimagine agile, strategic budgeting.


Delivered in dynamic financials, DreamCORE Dashboards provide green data, updated daily. This strategic, robust financial tracking system looks back historically to show not only where you’ve traveled but the road ahead of you as well. Your data, assembled chronologically, with the ability to scroll and drill down by department, eliminates the scrambling to find everything you need and the shuffling of multiple sources.


Ongoing Reforecasting


DreamCORE Dashboards offer predictive analytics with a “What If” feature. Want to determine your Housekeeping budget based on PPD? Simply plug in your desired PPD and DreamCORE will calculate the amount.


The pandemic showed us the financial impact of a wildly swinging census. DreamCORE Dashboards updates your census daily, and recalculates spend-down accordingly. Each of your front line managers who make spending decisions has daily access to their budget, adjusted by census. How much better could you control expenses when all front line teams are trained to contribute to the overall company financial strategy?

DreamCORE Dashboards budget planning

5 Tips for your 2022 Budget 


1.Assemble historical data for the past two years

If you’re already using DreamCORE Dashboards, this work is done and your 2022 budgeting is well underway. DreamCORE Dashboards integrate your EHR, Book of Record, and Payroll/TimeClock systems into a relevant order for evidence-based decision-making.

2. Evaluate strengths and weaknesses from this data

While this can be an arduous task, data speaks the truth. With DreamCORE Dashboards, red flag anomalies in your data alert you daily enabling the quick action to get back on course. Weaknesses can be easily reduced in real time.

3. Convene with company strategic leaders

Senior management and your finance team have valuable input. Weave the business plan into the budget, strategize and decide how to address the inevitable unknowns. Determine new KPIs and how to pivot when needed.

4. Engage your strongest front line leaders

Essentially these are your budget managers. A large proportion of the spending happens In the facilities. Your front line has insight to challenges you may not be prioritizing. Learn from them for more realistic budget planning.

5. Book a live demo of DreamCORE Dashboards

Our current clients are breathing a sigh of relief knowing they have an agile system for spending management and cost control. The “work” of creating a 12-month budget is largely complete – an easy review of historical data, a relevant view and breakdown of revenue, and daily drillable access to every dollar spent.


Budget planning for a new fiscal year enables a strategic plan for managing the revenue and expenses. The budget provides a plan for all teams in the organization to follow. Yet, the past 18 months have shown us that a static plan is useless. 


With access to accurate historical financials and predictive analytics, your budget takes on a dynamic reality. Ongoing forecasting, departmental budgets adjusting to census, year over year and month over month comparisons are the new approach to financial management.


DreamCORE Dashboards is the GPS to keep your business on course to success. Contact us today to get started – you’re just 3 logins away from powerful analytics. 


SNF Operators – Know Your PBJ Staffing Star Ratings… before they post

SNF Operators – Know Your PBJ Staffing Star Ratings… before they post

What would it mean to your organization if you could watch the trend of your CMS PBJ staffing star ratings … daily?

Payroll-Based Journal (PBJ) is the report used by the Centers for Medicare and Medicaid Services (CMS) to evaluate levels of staffing in a skilled nursing facility as it relates to quality measures. To determine the quarterly PBJ staffing star rating, the intricate formula calculates RN and overall staffing against census and complexity of the patients.

The formula, while intricate, can be a useful tool for SNF operators who wish to make a positive impact on their quarterly ratings. However, doing the calculations manually would be an onerous task. Filling out the quarterly report for CMS based on time clock data is complex enough without trying to manually figure the calculations.

At Prone 2 Dream, we believe there’s a better way – a prospective approach. By viewing timeclock data and census together on a daily basis, a SNF operator and their Director of Nursing can make evidence-based decisions when scheduling. Dream CORE Dashboards is a business intelligence solution that provides daily tracking of your time clock data, as well as Overtime Analysis, Earnings Reports, Wage Analysis, Labor Distribution and more.

By watching your DreamCORE Dashboards on a daily basis, you have actionable information to positively impact your PBJ staffing star ratings.

Missing an RN one day? Set your DreamCORE to alert you – so you can correct the situation before it becomes part of your permanent CMS record.

When you have access to your daily PBJ staffing star ratings and make data-driven decisions on a daily basis, you can:

> Optimize clinical staffing dollars

> Equip your team to stay ahead of timeclock data

> Gain insight on CMS adjustment trends

Daily visibility of PBJ star trends brings stability, and ultimately enables you to project what each quarter’s stars will be. DreamCORE takes the mystery out of PBJ reporting.

Contact us for a Live Demo.


PBJ Staffing Star Ratings Infographic

error: Content is protected !!