Role Based Access Control for Skilled Nursing Business Intelligence

Role Based Access Control for Skilled Nursing Business Intelligence

Data drives decisions, evidence-based decisions.


Yet, in the world of breathtakingly fast data analytics, how can you be certain that only the right people are seeing sensitive data? This is the purpose of Role-Based Control Access (RBAC) also known as Role-Based Security (RBS).


What is Role-Based Access Control (RBAC)?


Each person in an organization has a position or a role. RBAC sets a framework whereby each employee only has access to data that is pertinent to that role. If the individual has responsibility for budget decisions for a specific department, he/she has access to that data only and no access to other departments.


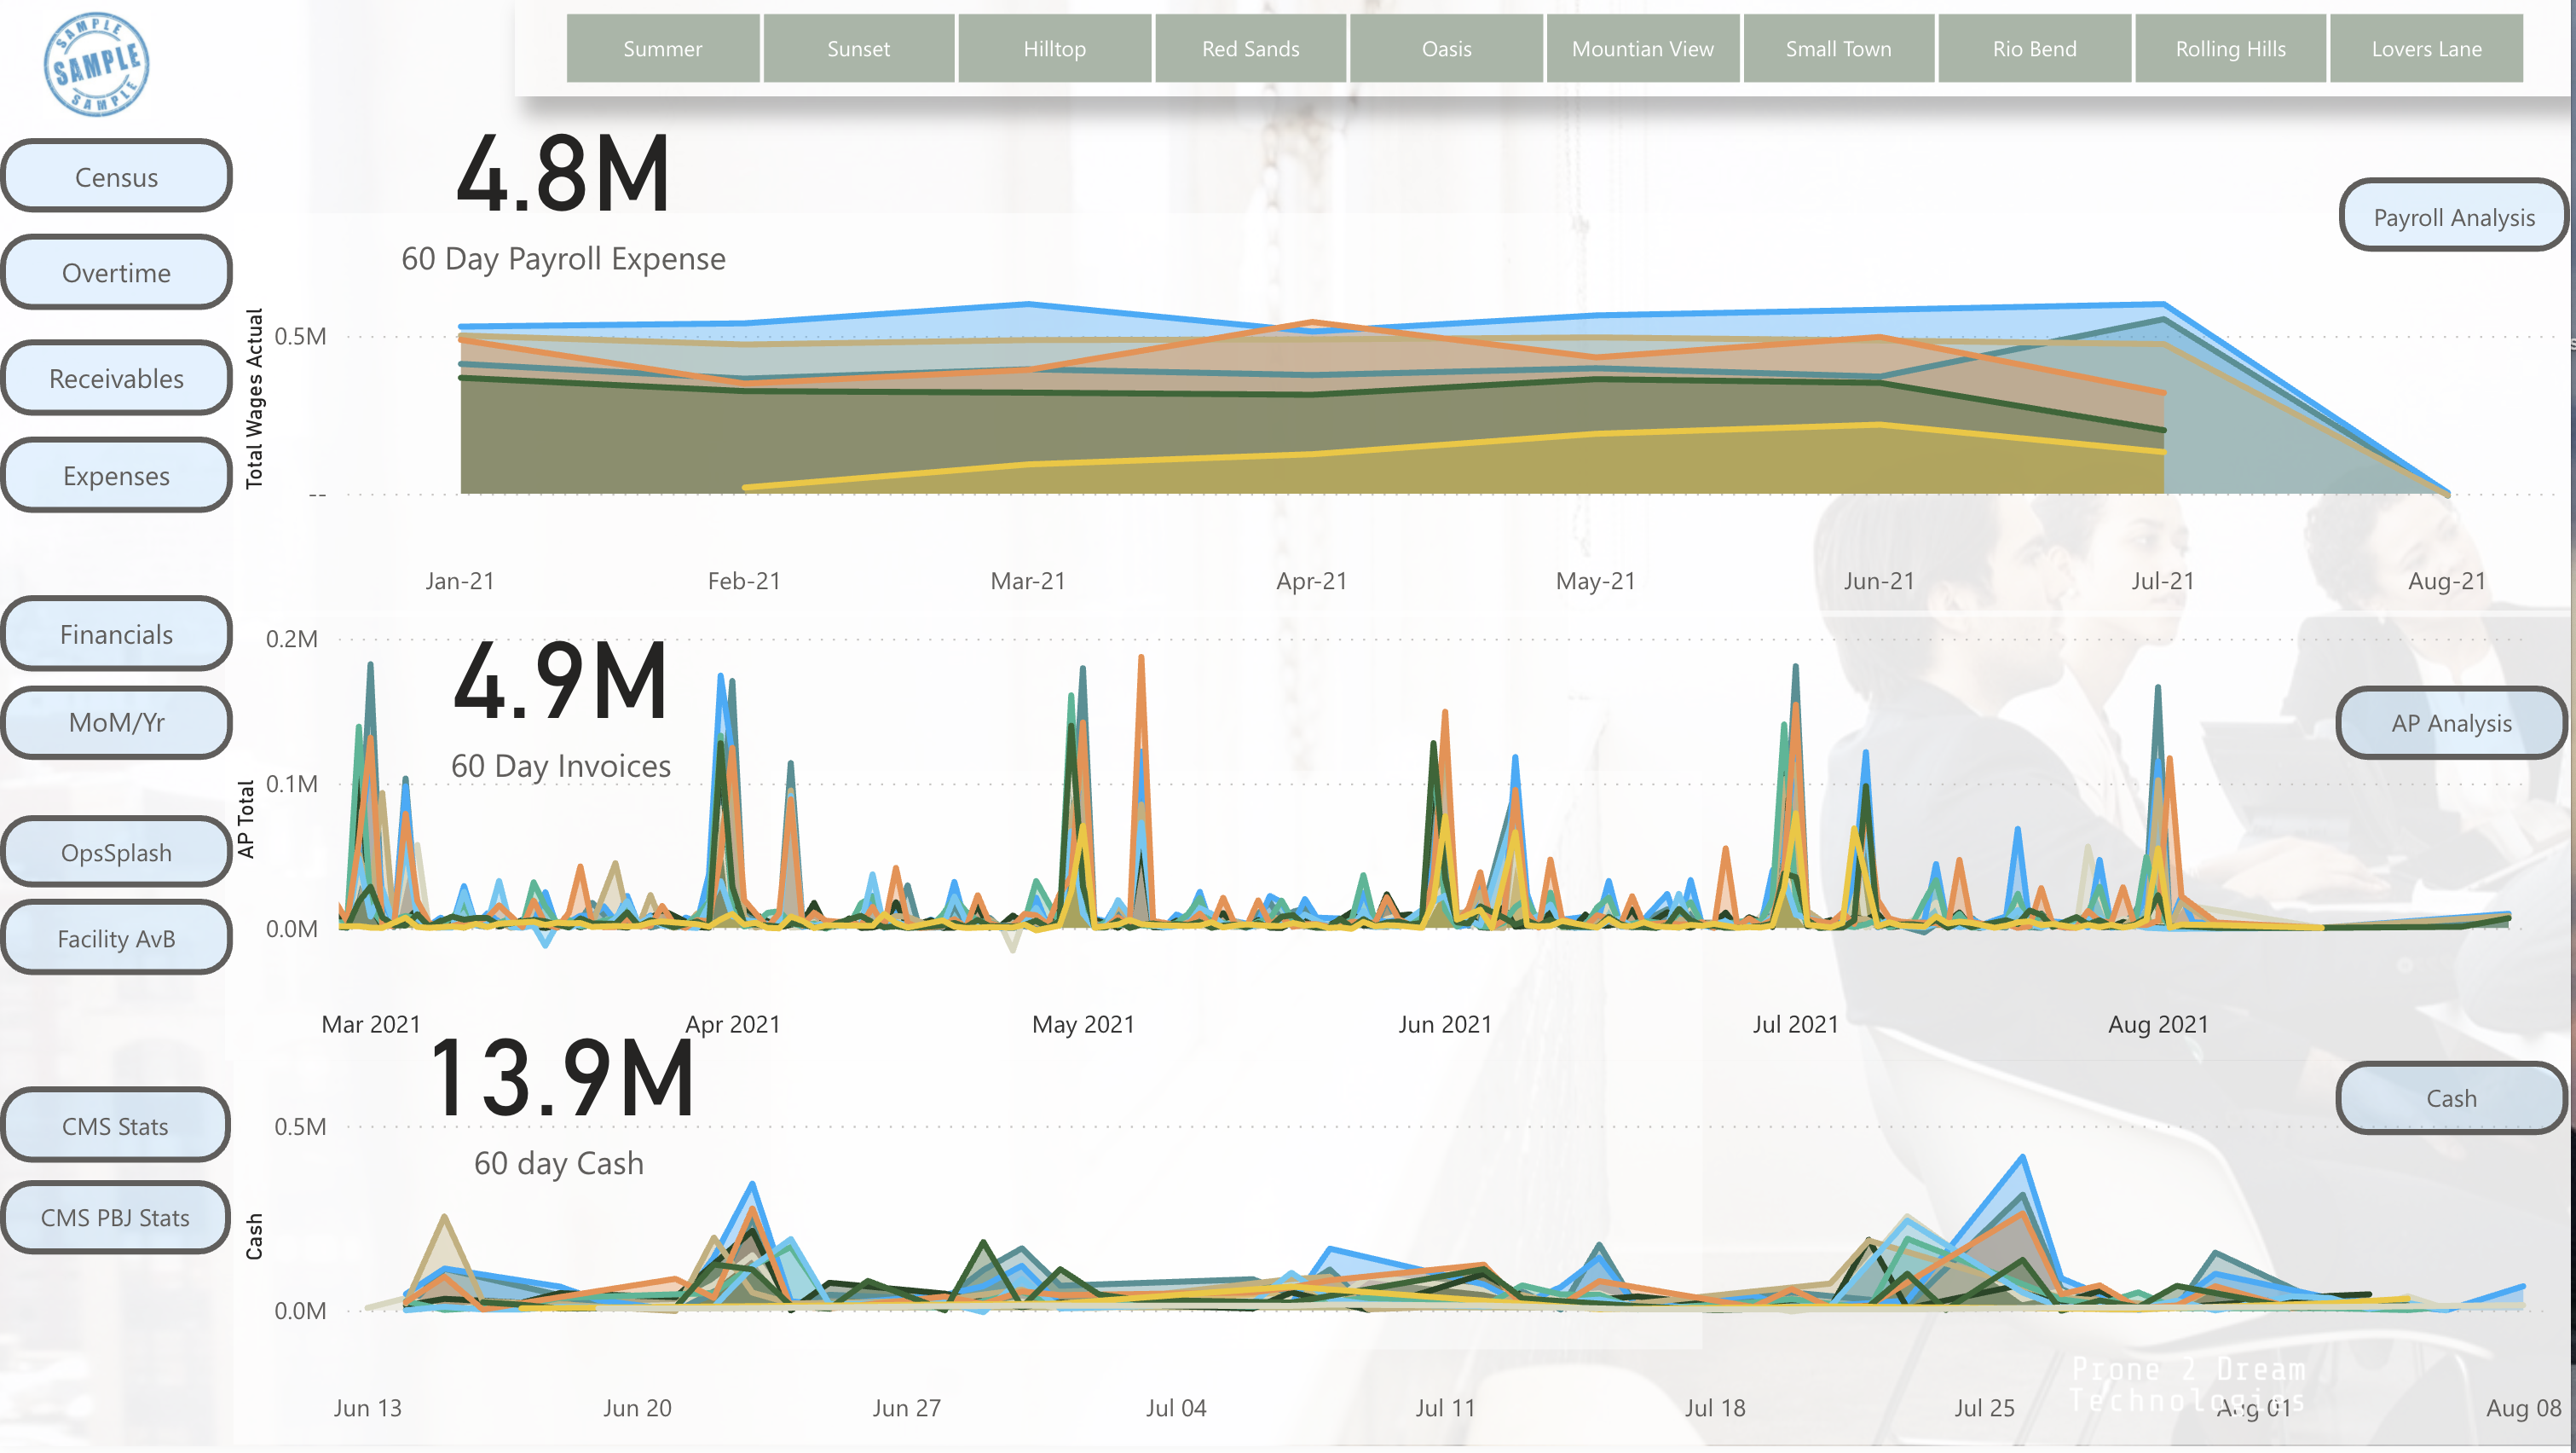
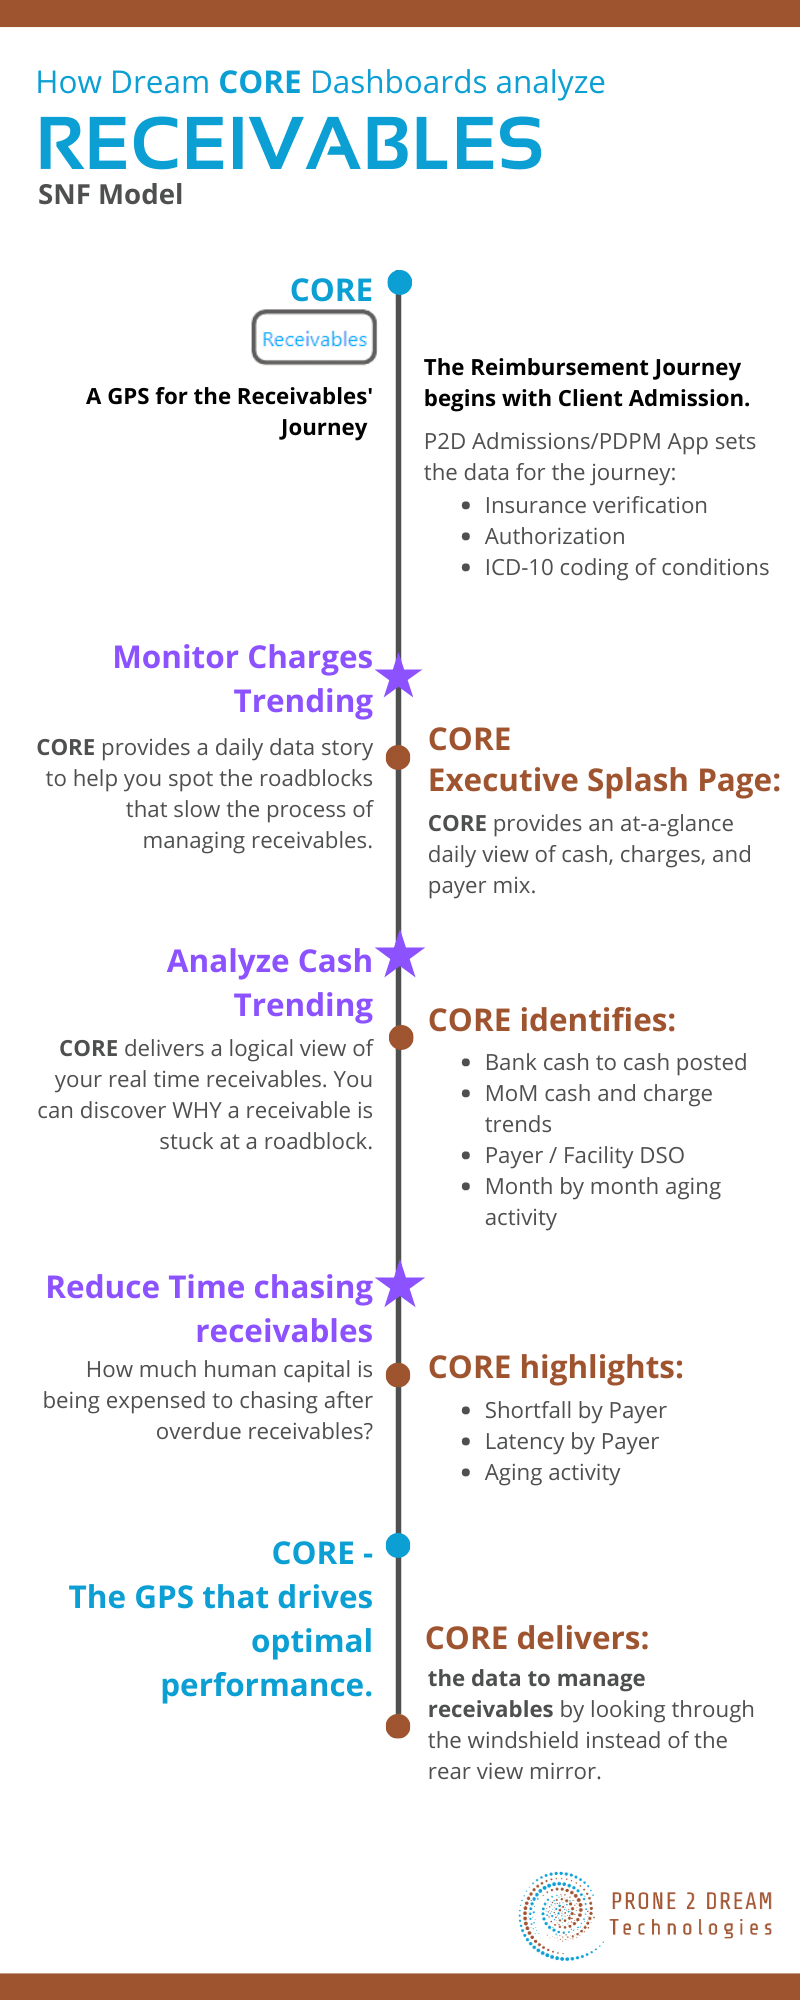
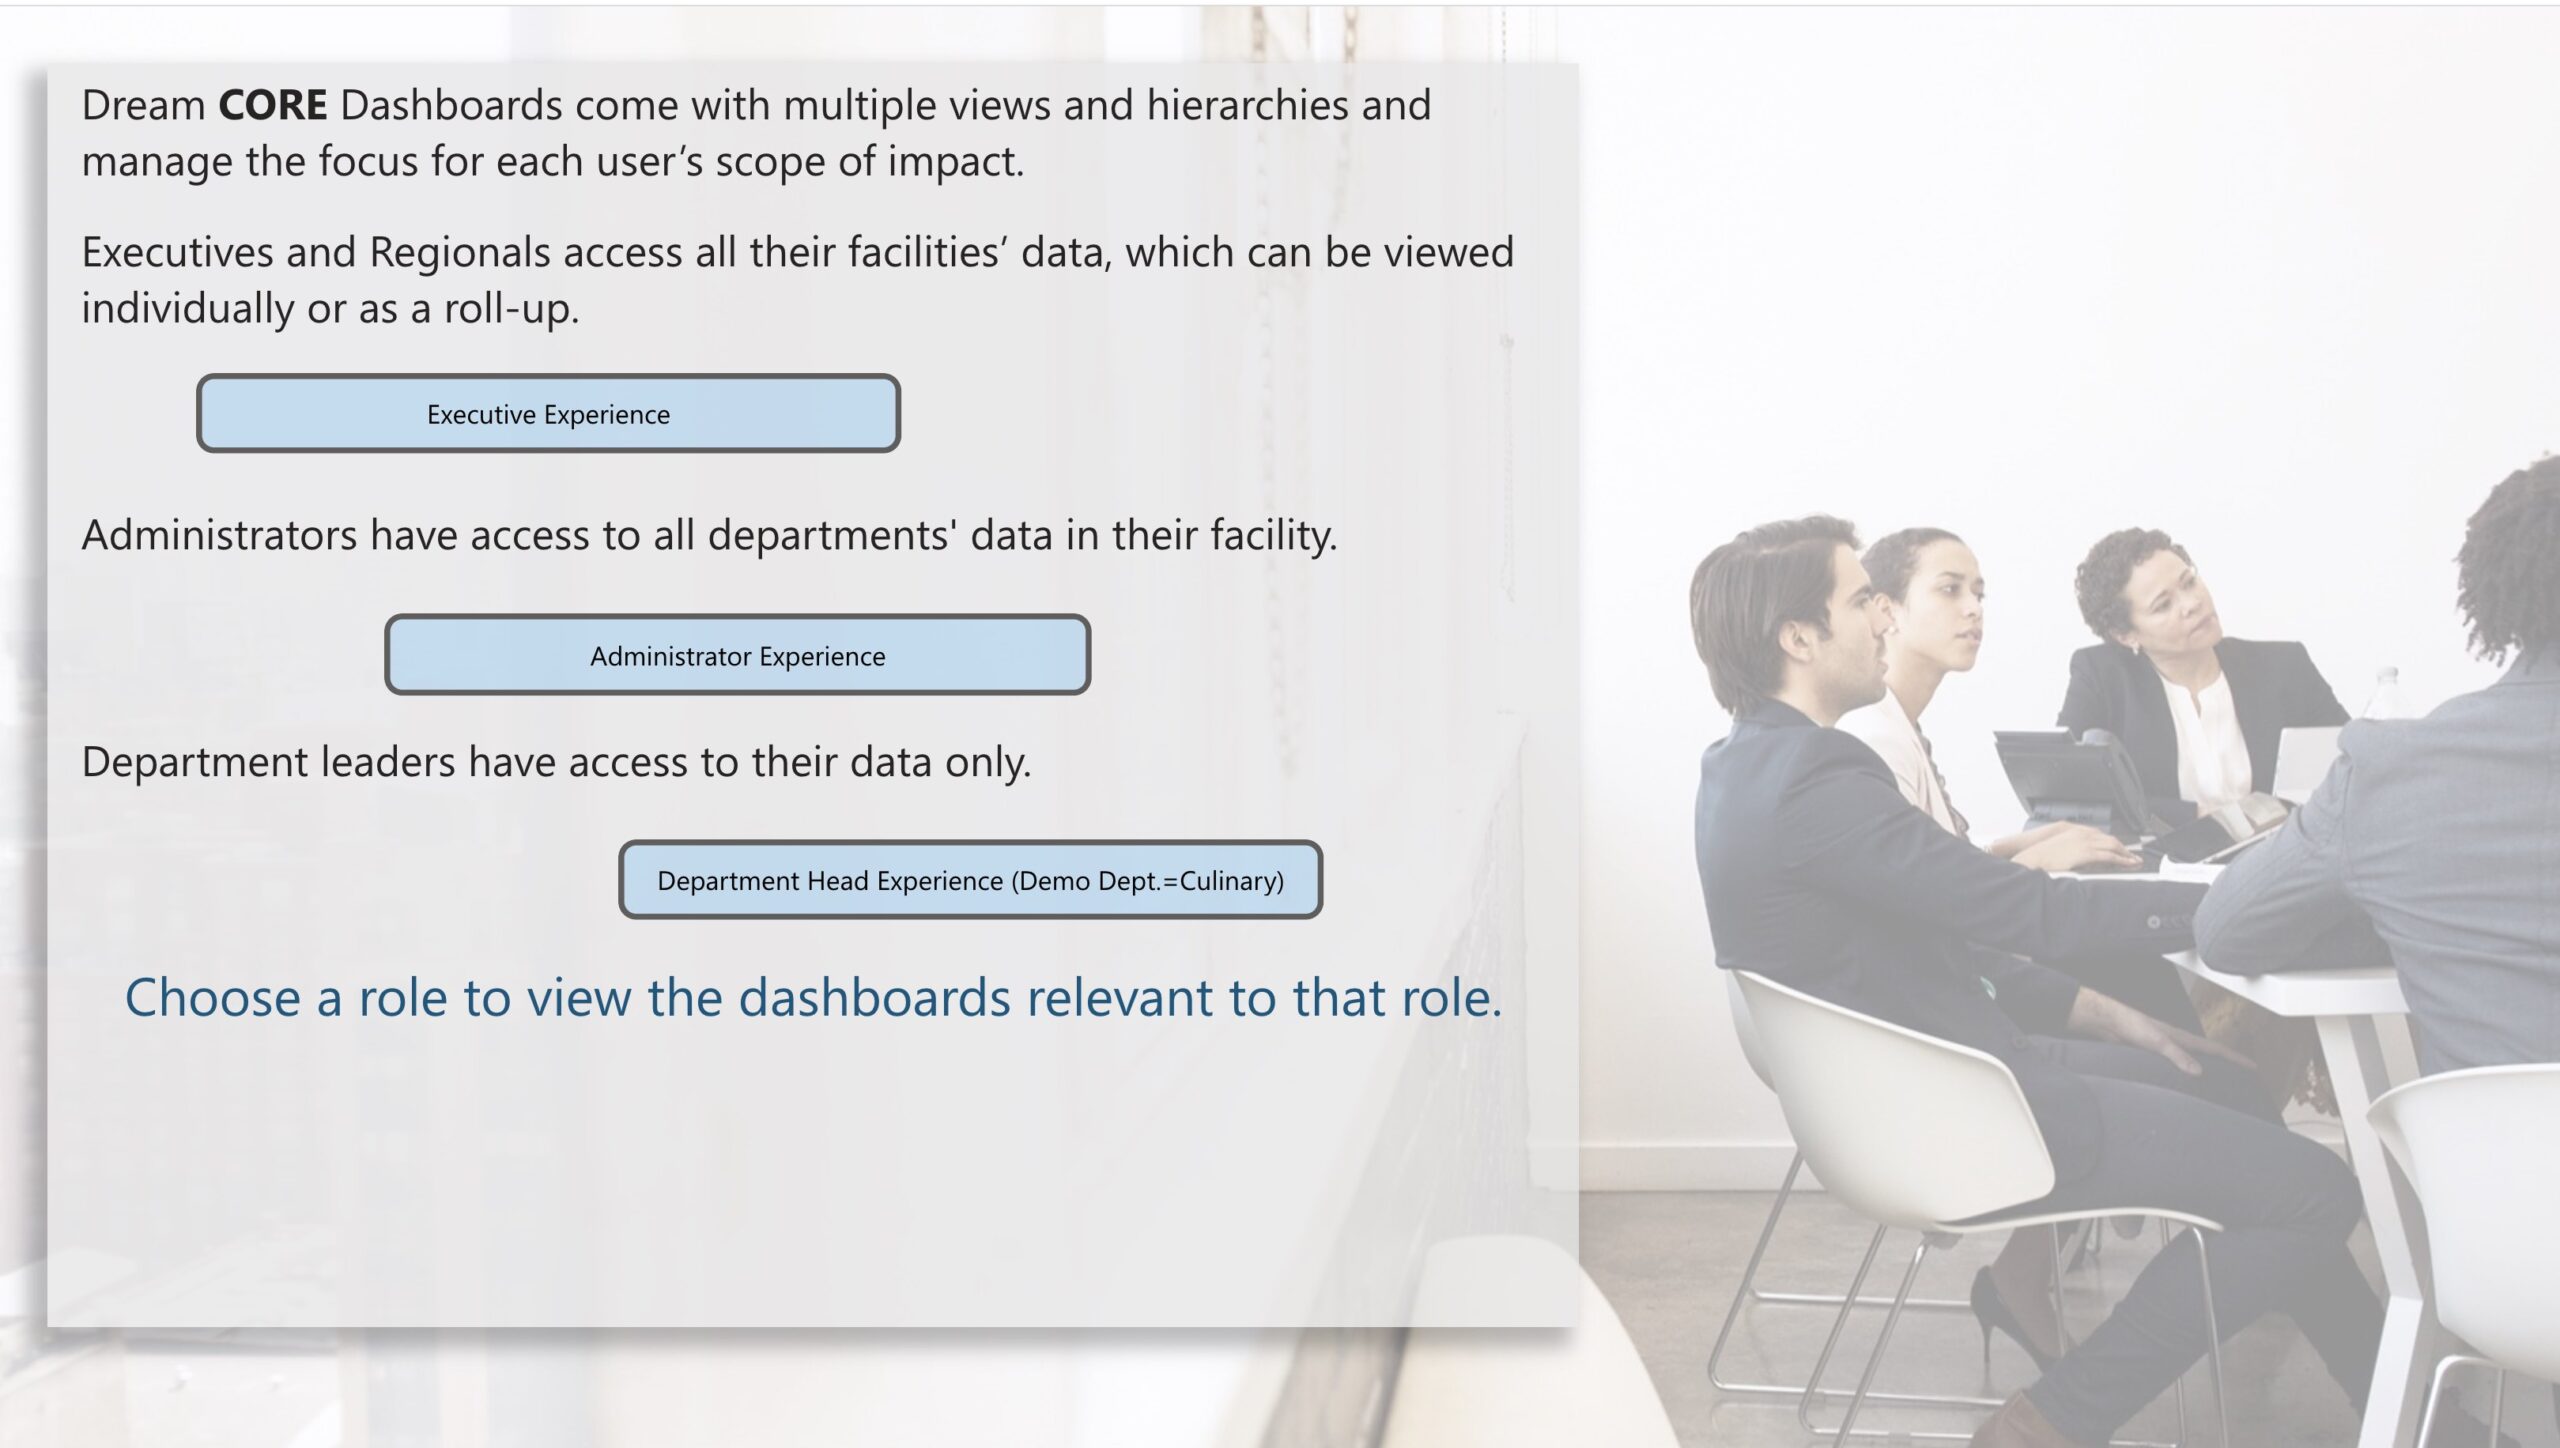
Prone 2 Dream Technologies deploys RBAC for its DreamCORE Dashboards. Skilled Nursing business intelligence is delivered in drillable dashboards with a focus on Census, Overtime, Receivables, and Expenses. These are the CORE of the business and where frontline department leaders are making decisions about how to spend the company’s revenue.


These leaders are expected to contribute to the overall profitability of the company. However, they typically have to wade through data overload by signing into multiple platforms or shuffling multiple spreadsheets to find what they need to make decisions.


DreamCORE Dashboards presents the plethora of skilled nursing data in a logical, relevant format, with infinite views. RBAC narrows the scope to each individual’s frame of reference – he or she only sees the data for areas where they can make an impact. They get the data they need… and ONLY the data they need.


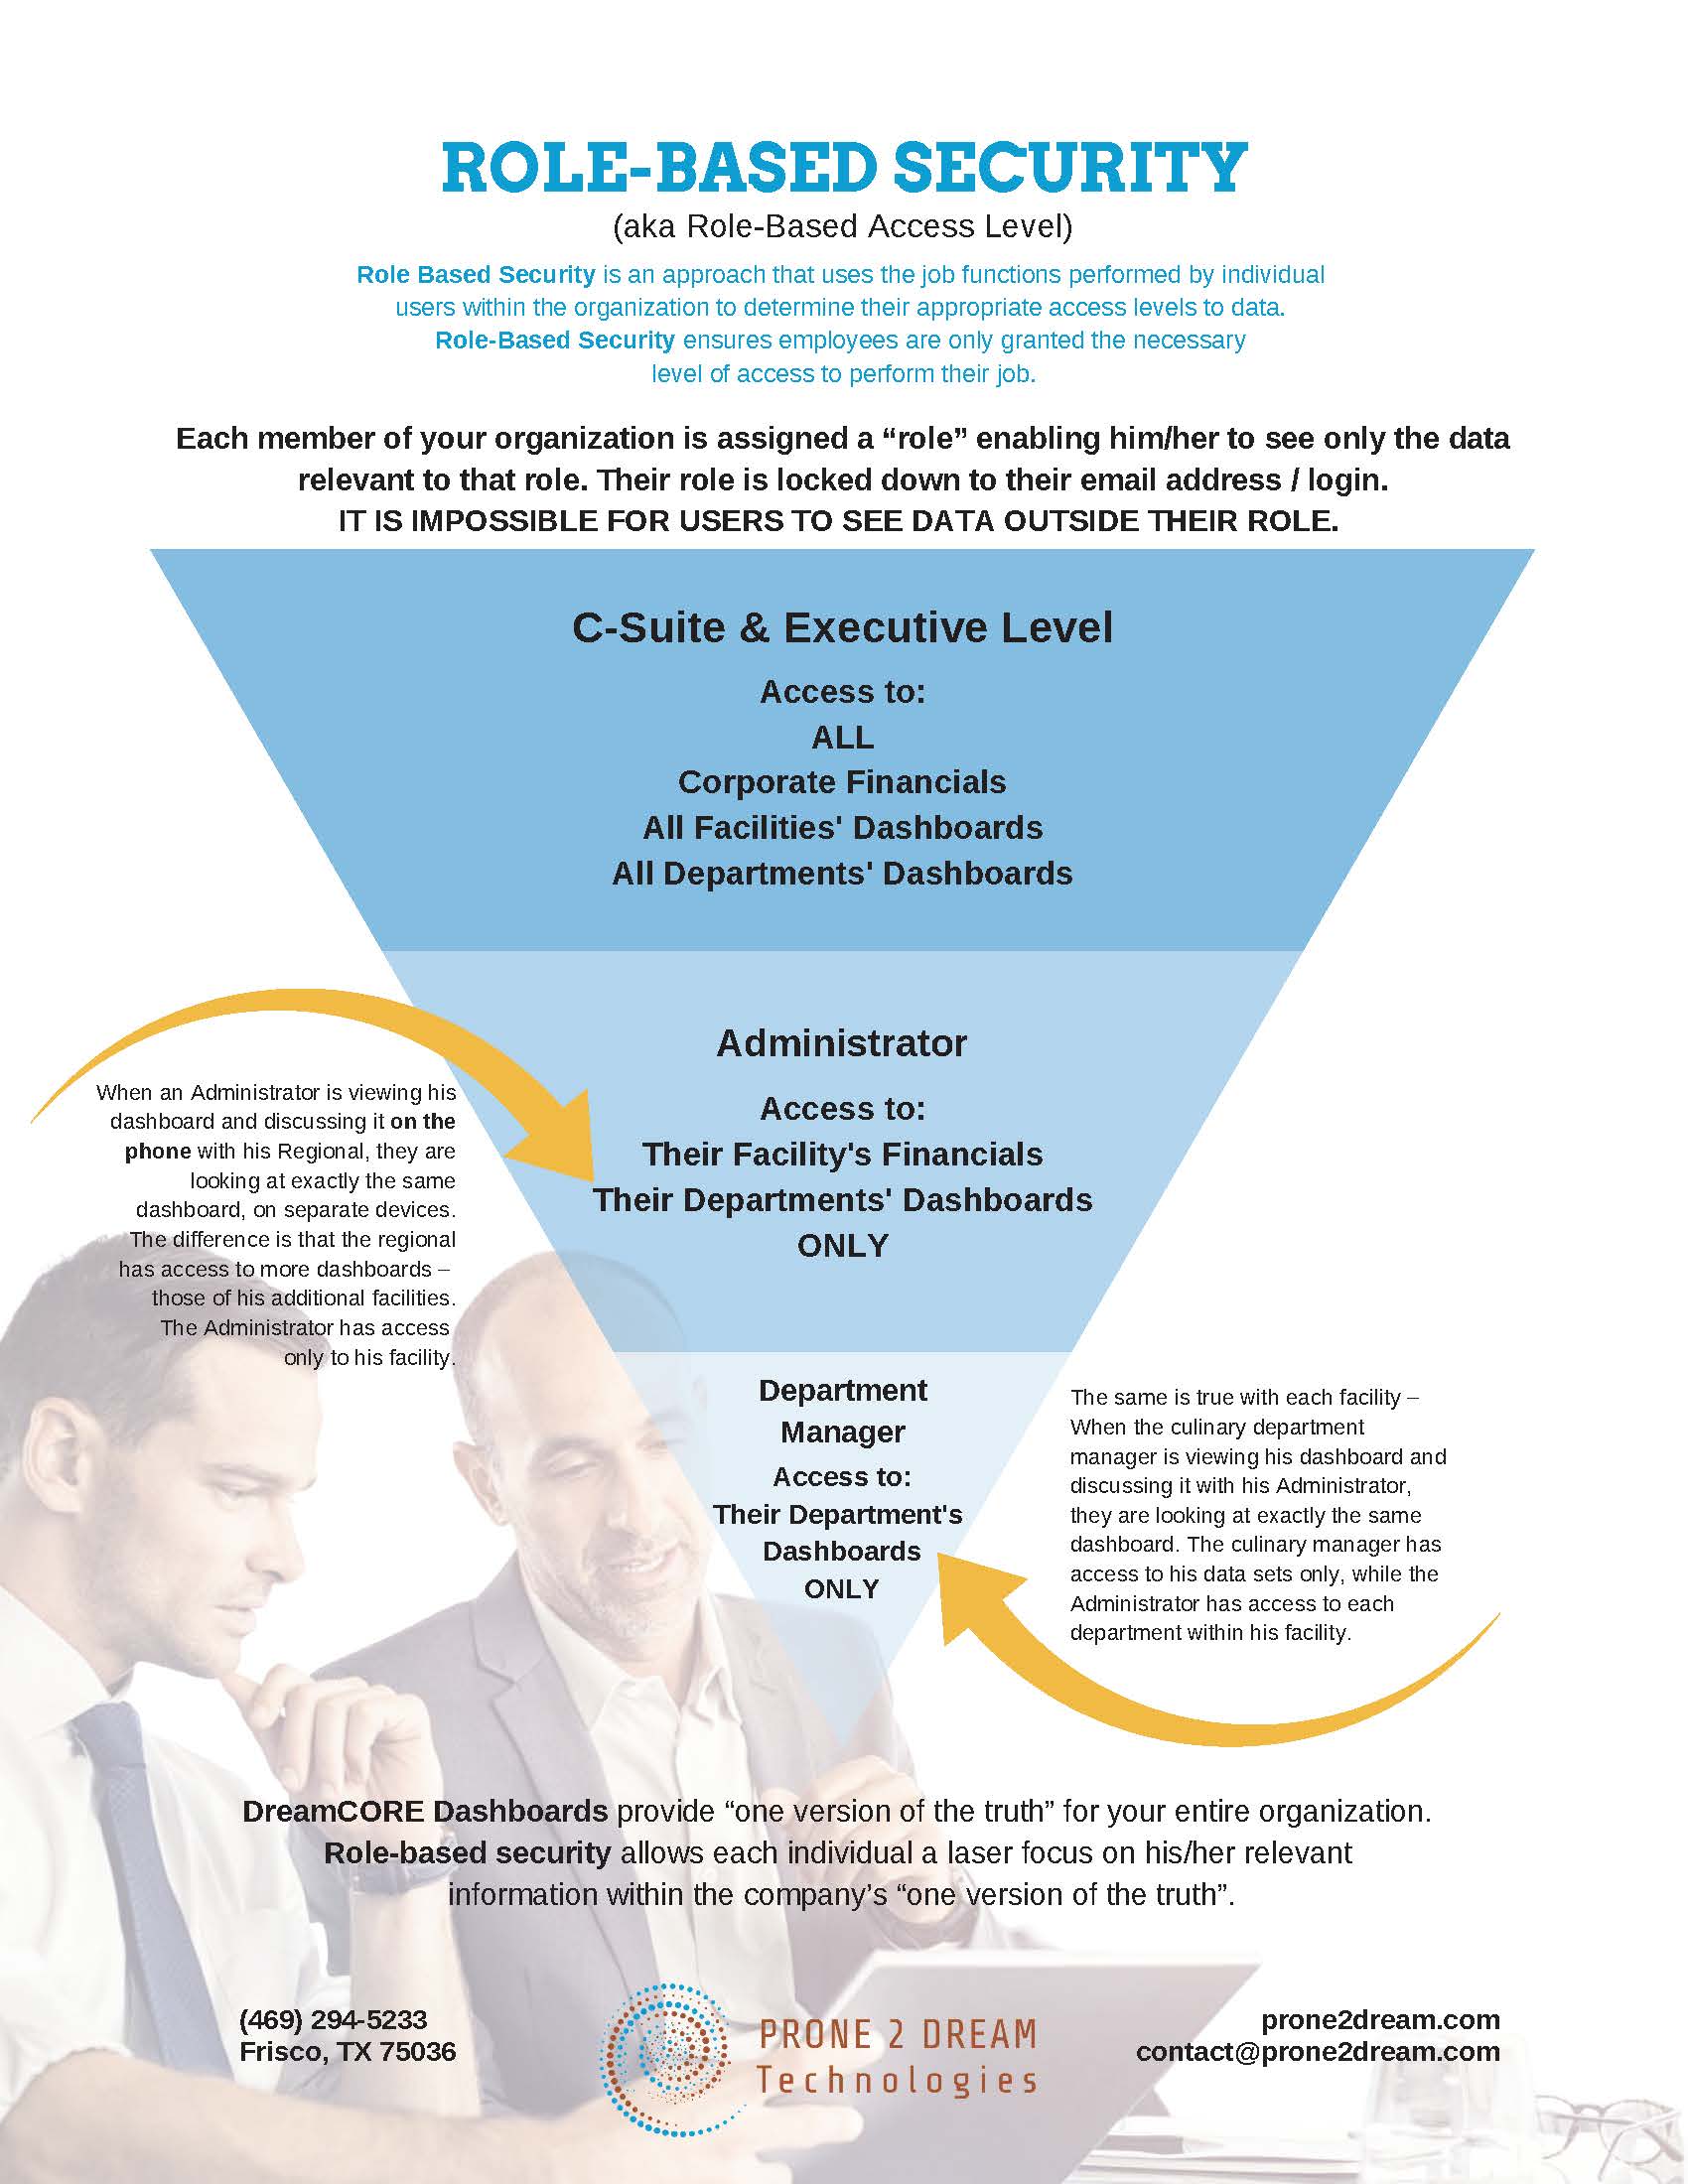
Here’s the RBAC framework for DreamCORE Dashboards:


RBAC Framework


Examples of Role-Based Access Control


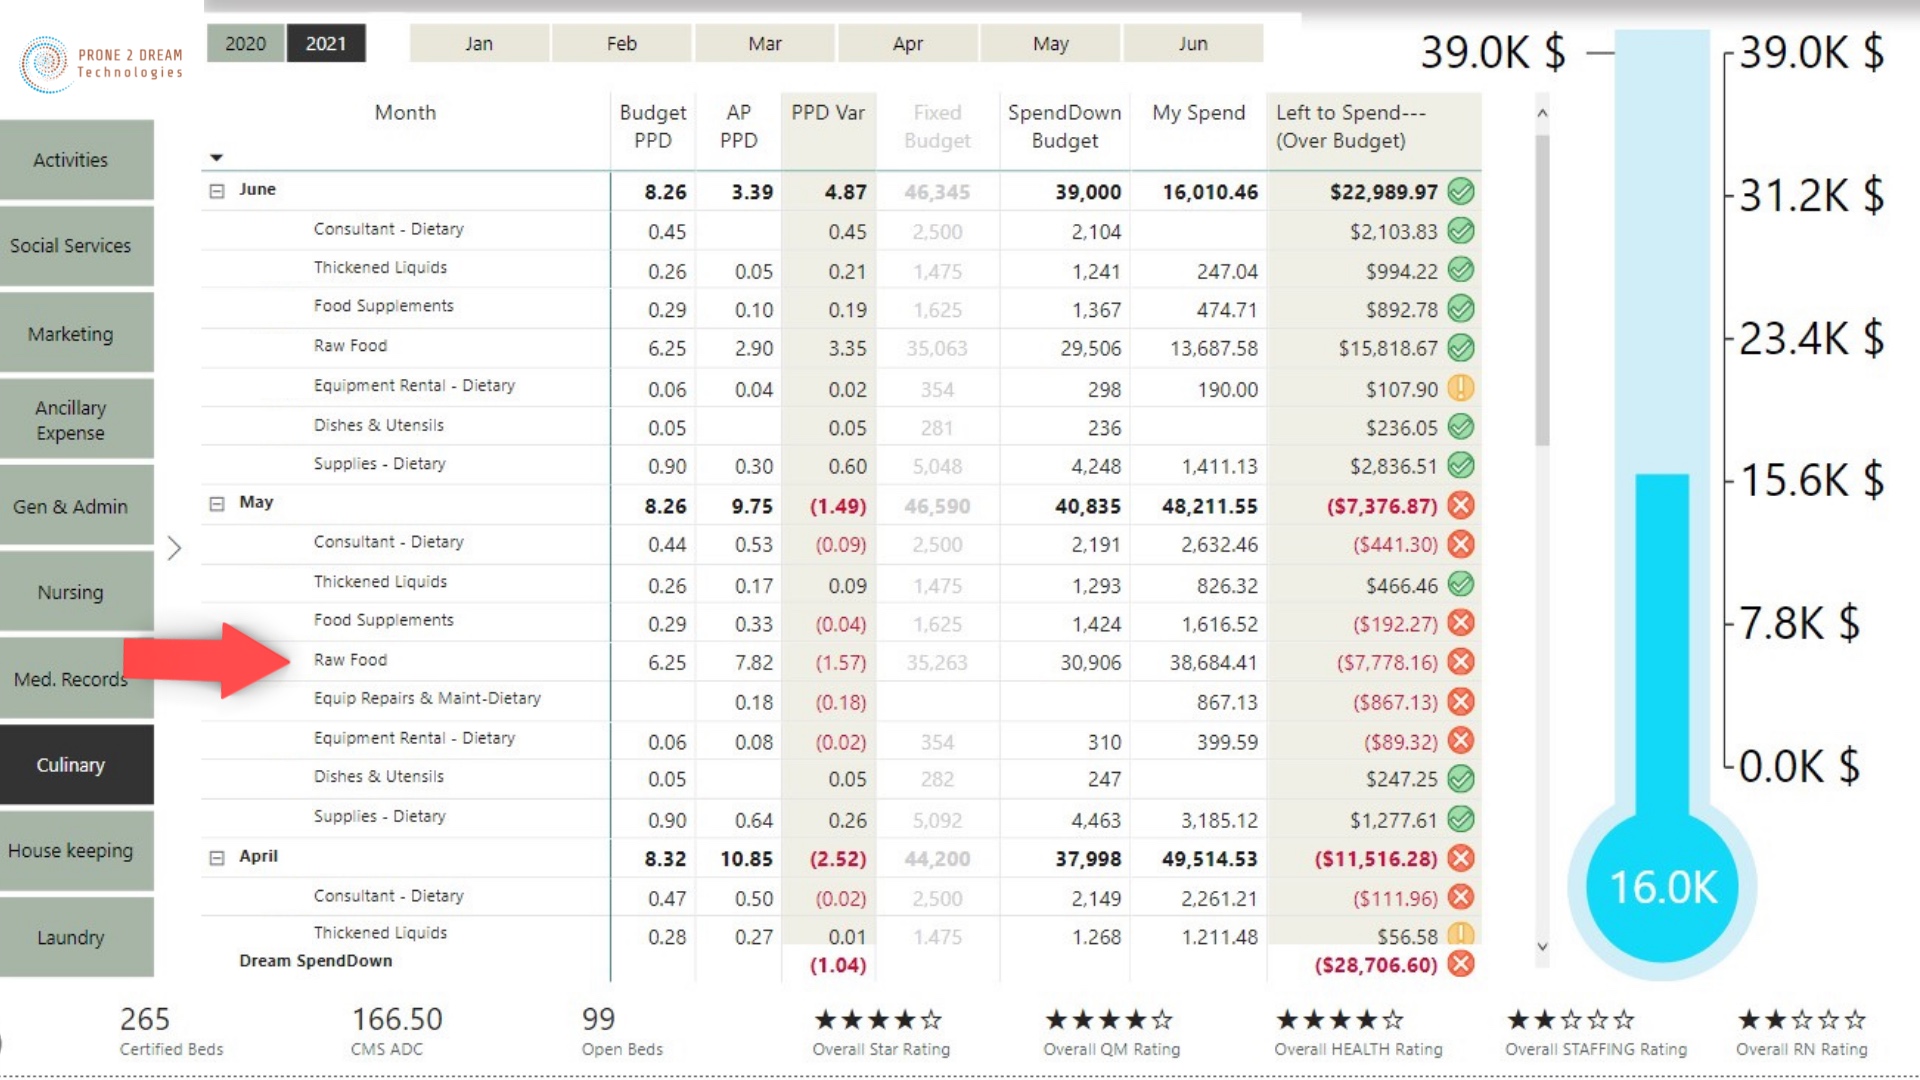
Culinary Manager – Sees payroll, overtime, and department budget adjusted daily per fluctuating census only for the facility’s culinary department


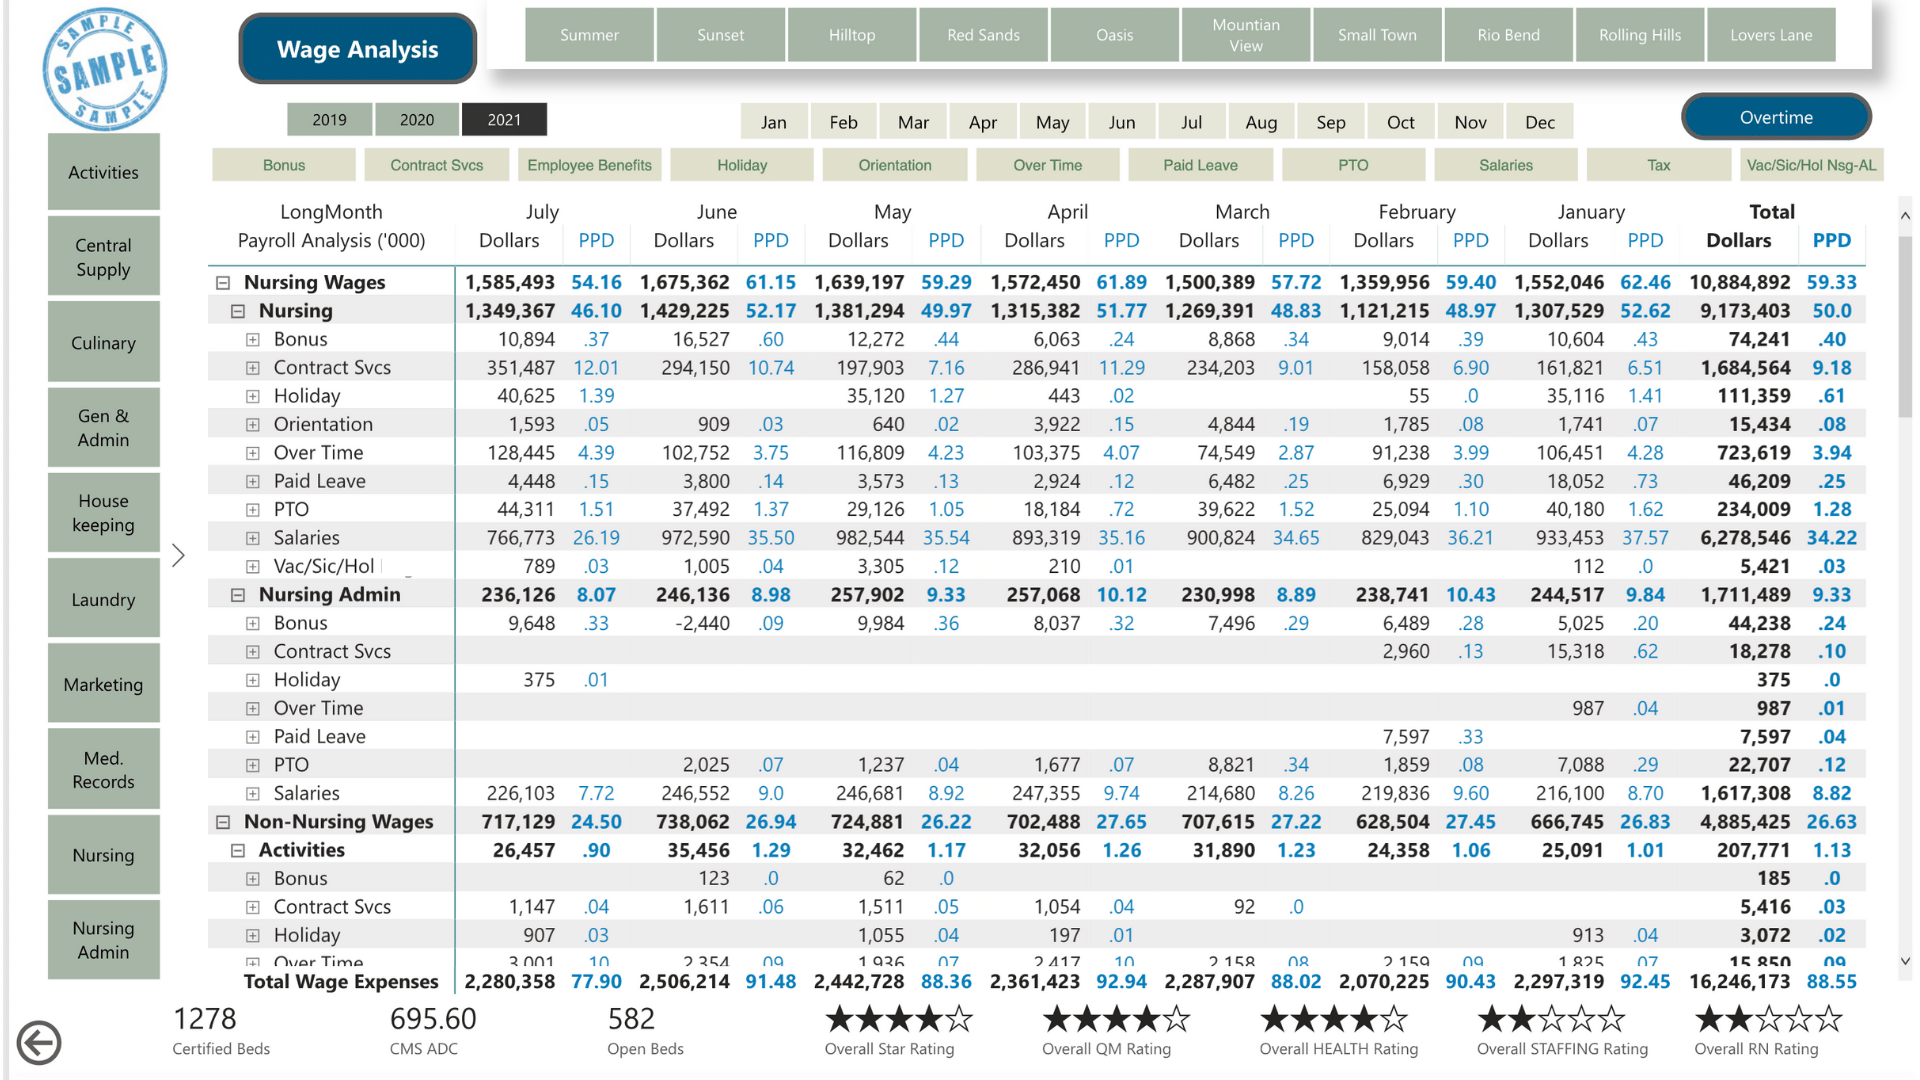
Director of Nursing – Sees payroll, overtime, and department budget adjusted daily per fluctuating census only for the facility’s nursing department. Plus, she sees a daily tracking of her CMS PBJ star rating – data only relevant to her role.


Facility Administrator – Sees all the data relevant to that specific property/location.

Regional Director – Sees all the data for the facilities he oversees.


Executive Team – All the data for all the facilities, as well as corporate financials, P&L, forecasts, Payroll Analysis, and more.


As a result, sensitive data remains secure, and each individual is aware that their focus is different from another within the company. Yet DreamCORE Dashboards provide one version of the truth, updated daily.


Two individuals in different roles, but who have access to the same dashboard page are both seeing the same data. For example, a regional director has a virtual meeting with a facility administrator. They are both seeing that facility’s “green data” – one version of the truth, updated daily.


Benefits of RBAC in DreamCORE Dashboards


  1. Protects sensitive payroll data. Most department leaders need to control schedules and overtime expense, yet need to keep wage rates secure. DreamCORE Dashboards provides that security while allowing leaders to make data-driven decisions.
  2. Protects patient data. DreamCORE Dashboards focus on the financial data of a patient’s stay and it’s only available to certain roles, as defined by executive leadership.
  3. Eliminates data overload at the front line. Narrowing the focus is the first step towards positive outcomes – DreamCORE Dashboards are a tool for front line success.
  4. Ease of change. Individuals’ roles change – whether they are adding responsibilities, moving to a different facility, or getting a promotion, changing access is as easy as contacting our support team.

Role-Based Security

Learn more about Prone 2 Dream’s Role-Based Security.


The Ease of Single Sign-on


Nobody needs yet another set of login credentials to gain access to their data. Prone 2 Dream is a Microsoft Partner, so with your current Microsoft account, your team simply logs in to their email account and access to their dashboards is a click away.


Our single sign-on feature mitigates the risk in accessing third-party sites, reduces time spent accessing multiple accounts, lowers the total cost of ownership of IT with fewer help desk / support ticket requests, and creates happy users.


Empower your front line leaders


Data drives decisions. If your facilities are wading in data overload or simply don’t have the time to shuffle through their various papers and platforms, book a demo of DreamCORE Dashboards today.


We understand that data can be intimidating, especially to department managers who were hired for their acumen in distinctly different areas. We take pride in providing onboarding and training for your teams and helping them learn to love their numbers.


Your Daily Data Story… the Pulse of Your P&L

Your Daily Data Story… the Pulse of Your P&L

What would it mean to your organization to have the pulse of your P&L available to you every morning? Imagine, instead of shuffling multiple reports or clicking through multiple browser screens, one dashboard with the ability to drill down on red flag anomalies highlighted by daily green data.

One-Stop-Shop of Cash Position


DreamCORE Dashboards sort data from your book of record, EHR, and timeclock/payroll system into logical, relevant views every day.

Using real time data enables evidence-based decisions – you can provide clear direction to your teams for growth and improvements.

A daily data story enables confident reports to stakeholders, without any of the heavy lifting of creating custom reports – the pulse of your P&L is available to you every morning, at a glance, with your coffee. Consider the ease of discussions around profitability.

Drill Down into Cash Position


With the click of a button, you have your daily cash analytics – daily deposits, trend by month, by roll up, or by individual facility – this is a bird’s eye view of where you stand today, relative to payroll or other large expenses.

With daily green data, you have one version of the truth. Executive leadership sees the comprehensive view of the organization. Our role-based security protocols keep high level analytics protected. You’re able to share appropriate information with investors, REITs, and stakeholders. And, you can share different, yet appropriate information with your senior leaders. All viewers are seeing the green data, updated daily, one version of the truth, yet the screens that are only relevant to their role in the company.

Payroll Analysis picks up GL code to display daily PPD and dollars PPD


Your comprehensive dashboard is flexible for you to “lock down” to specific views. DreamCORE Dashboards have been designed to enable SNF companies to transform data overload into relevant views. Remove the clutter to drill down into any specific facility, department, even employee timecard – to give you perspective on true action needed. You can confidently make evidence-based decisions.

Having a daily pulse on payroll enables the ability to manage overtime, improve CMS star ratings, improve contractual agreements, and serve your clients to the best possible outcomes.

A facility DON typically doesn’t have an MBA. Nor do your other facility department leaders. Yet, each one is expected to contribute to the profitability of the company. With DreamCORE Dashboards, you equip your regionals and administrators with the mentoring tool so each can manage their department’s numbers to success.

A Daily View of Spending


DreamCORE Financial Dashboards - Daily Data Story - Budget


DreamCORE Dashboards adjust the budget daily based on current census. You have true PPD according to true census, and can drill down by month, facility, and department. With this budget scaling, your regional directors can assist facility leaders to understand and successfully drive toward corporate goals.

Your EBITDA metrics are also calculated, showing your overall daily operating performance. This is an accurate view for investors and other stakeholders.

3 “Reporting Only” Logins and You’re 7 Days Away From Powerful Analytics


While DreamCORE Dashboards are a complex compilation of your critical KPIs, they couldn’t be easier for you to attain and use. Prone 2 Dream Technologies does all the heavy lifting. Deliver us three reporting-only logins and we’ll deliver your dashboards in 7 days. You will have single sign on access with your existing Microsoft account. As Microsoft partners, we host your data in our secure portal, and you can simply open a browser window to view it.

Want to start reading your daily data story? Book a live demo today.


Ken K. Adams, M.D. Joins Advisory Board at Prone 2 Dream Technologies

Ken K. Adams, M.D. Joins Advisory Board at Prone 2 Dream Technologies

Frisco, TX – Prone 2 Dream, LLC is pleased to welcome Dr. Ken Adams, CMO, United Healthcare Medicare for Texas, to its Advisory Board. Dr. Adams is a Physician Executive with in-depth healthcare experience and a proven track record of success in strategic planning and growth, senior leadership development, implementation of action plans and best practices.

“Prone 2 Dream has been instrumental in several of my analytics projects, bringing visionary storytelling to complex data sets. I’m grateful to be invited to be a part of Prone 2 Dream’s Advisory Board and help shape the vision and strategic initiatives of the company,” said Dr. Adams.

Dr. Adams advised on the research, development and testing of Prone 2 Dream’s flagship product, Dream CORE Dashboards, which was released to the skilled nursing industry in February 2021. Dream CORE Dashboards survey facility activity daily to provide an unobstructed line of sight into KPI’s, helping SNF leaders quickly identify obstacles on the road to profitability.

“Dr. Adams’ background and expertise provide a broad perspective on the industry we’ve chosen to serve,” said Leona Fink, Prone 2 Dream Founder and CIO, “We are excited to have his leadership and passion supporting our growth.”

For more information and to take a test drive of Dream CORE Dashboards, please visit https://prone2dream.com/

SNF Operators – Are your financial projections data-driven?

SNF Operators – Are your financial projections data-driven?

What if you had a tool to capture Midnight Census and make daily PPD calculations for you?

We have that tool – DreamCORE Dashboards. DreamCORE provides unobstructed visibility into KPIs, helping SNF leaders quickly identify obstacles on the road to profitability.

DreamCORE gives insight into Payer Mix, projects revenue, adjusts budgeted expenses for SpendDown, and calculates current HPPD.

If this sounds like it would save you lots of time, you’re right.

Check out the benefits of the Census feature in DreamCORE Dashboards in the infographic below.

Book a live demo – Grab a spot on our calendar here.

SNF Operators – Reduce Time Chasing Receivables

SNF Operators – Reduce Time Chasing Receivables

How much of your human capital is being expensed to chasing receivables?


With DreamCORE Dashboards, you have a daily data story showing cash trending and charges trending, shortfall by payer and much more. It’s an at-a-glance daily view of your cash flow status.


When a new patient is admitted, critical data enters the EHR. DreamCORE Dashboards integrate the EHR with your book of record to deliver a logical view of real time receivables.


Having a daily view helps you identify roadblocks that cause receivables to enter the aging status … where they are less likely to be realized. Dream CORE displays historical data to measure trends and provide insight for improvement.


Check out the benefits on the infographic below.

Book a live demo – Grab a spot on our calendar here.


Revenue and Roadblocks: Right Now on the Right Route

Revenue and Roadblocks: Right Now on the Right Route

You use many software platforms to run your business, and each offers a dynamic set of metrics.


What if you had a way to see how those metrics affect each other? A way to align them – showing the best route to your destination (profitability) and alert you to roadblocks in your path?


In our last article, Business Detours? Not A Problem When You Set Your GPS, we described how business intelligence and predictive analytics form a GPS to help frontline managers navigate the financial side of your company.


Enter a GPS solution called DreamCORE Dashboards – CORE is an acronym for the controllable parts of your business: Census* | Overtime | Receivables | Expenses.

*This model was built for the skilled nursing industry but is applicable anywhere –C is your Customers or Clients, your revenue source.


Let’s take a closer look at Census, and how you can use this fluctuating element to improve both customer satisfaction and your profitability.


Census – The Lives We Care For


Census is the lives we care for within our skilled nursing facilities. Our clinical teams treat and care for the individuals entrusted to us, ensuring the right solutions to help heal in the best way, in the best atmosphere.


Financially, census drives the revenue. We need to capitalize on every dollar of revenue to support the mission of care – nursing supplies, dietary sustenance, entertainment, housekeeping, administration.


The industry has worked out multiple algorithms to ensure the best journey of the revenue dollar to the table– through a labyrinth of documentation, carve outs, comorbidities coding, and specifications that vary widely by payers.


What success have we had managing “the dollars on the table”?


Managing Expenses against Fluctuating Revenue


Staying true to the GPS theme, finance develops a roadmap yearly, the “budget”. It is well thought out, achievable, and precise. The day after it is published, the path to success begins to deteriorate. Road conditions are constantly changing (lower than expected census), unexpected detours (transmission on your van konks out), inevitably you must stop, take time to get a true sense of where you are on the map, and recalculate your path to the destination.


DreamCORE is constantly recalculating to support your goals – by providing you the pinpoint on the map of where you are at any given time, and where you need to go to stay on course to your destination.


For example, your dietary manager was budgeted $35,263 for Raw Food for May–pinned to his corkboard–this budget was calculated last October and was based on a census budget of $8.26 PPD. The actual census for May is averaging $9.75 PPD. If the dietary manager spends the original budget of $35,263, DreamCORE gives clear sight to the overspend of $7,778. The thermometer shows current spend against scaled budget – making it much easier to adjust spending to meet current census level.


A significant ROI of DreamCORE is based in the automatic adjustment of the budgets.


In the example above, the dietary manager’s expense dashboard would show the budget for his department is $26.747.  And daily the “Expected Budget” would be adjusted by the Average Daily Census in the background.  Additionally, with each invoice entered into DreamCORE, the budget balance would be reduced, like a checkbook, keeping the whole department informed of their current balance, helping them not to “overdraw” the account.


So being able to see the financial picture at a quick glance enables small changes, which over time make a big impact.


This automation keeps the patient at the center – each operational department is rotating around the patient, spending what is necessary to create the healing experience. Your teams are working with their patients, not sitting at desks looking at numbers. They’re solving people problems to create the best customer experience.


On the Journey to success


Consider you’re on the road to your destination and your GPS tells you there’s an accident ahead, you should exit now to the alternate route. You choose to disregard GPS and within a few minutes you’re at a dead standstill. Half an hour later, you pass the accident, but you’ve lost 30 minutes. Even speeding at this point won’t get you to the destination on time. A small change to the alternate route may have made the difference.


DreamCORE provides clear analytics to help you and your teams pinpoint their exact location, adjust for what is ahead, and equipping you to stay on course to the destination.


Getting your people to love their numbers

Road to Success

What if each of your department leaders were taught how to use a financial GPS to make the right decisions for their department?


Look at the flip side: “You don’t know what you don’t know”–When they don’t understand where they are or where to go, they’re on a path to fail. Nobody hires on to fail! They want to do well – to succeed at their jobs means they meet expectations.


DreamCORE encourages camaraderie – when all the departments are working harmoniously, they start to see how they can help each other toward the greater good. One department has an unexpected capital expense, the rest can tighten their belts a bit to balance that out.


As an operator, you want to be competitive. You want to hire the best person to run each of your departments. So you hire a great culinary talent to run dietary, but he’s probably not an MBA. He can easily be taught to read DreamCORE, understand the expectation, and DreamCORE can free his time to be where he needs to be – providing a great customer experience.


Your department leaders know their priority is the best customer experience. When they know where they are financially, they make the best decisions. They’ll make the best decision for the company every time because they want to feel good about their work. They want to succeed. And you know that successful teams reduce turnover and build great culture.


Teaching them how to read a quick DreamCORE view of their department can set them up to succeed, which leads to managing the dollars already on the table.


Give them a clear solution to feed that success.

Book a live demo – Grab a spot on our calendar here.


error: Content is protected !!