Business Detours?  Not A Problem When You Set Your GPS

Business Detours? Not A Problem When You Set Your GPS

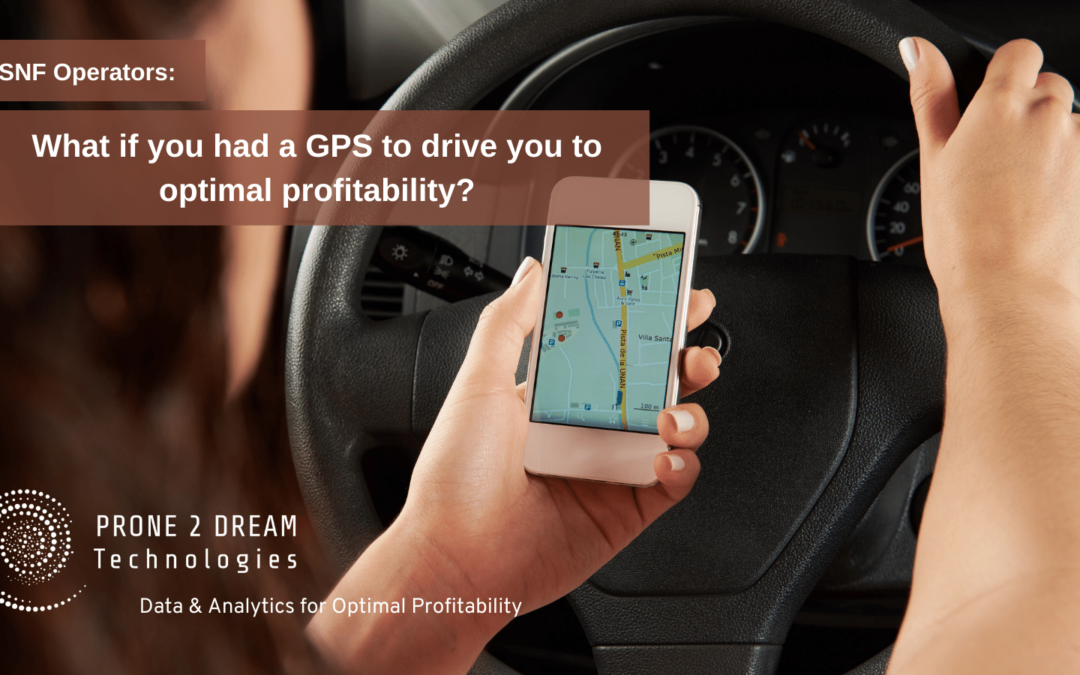
What if you had a GPS to drive you to maximum profitability?


Why do we like GPS? It not only gives us the best route to our destination, but it also identifies roadblocks in our way. You hear “Accident 12 miles ahead in the right lane, 27-minute delay, exit now to take the alternative route”. The roadblocks are actually reported by other users of the app, and because of their contribution to your journey, you are able to make a timely decision, avoid the pitfall, and arrive on time. Imagine your phone battery was dead on this same trip and this information never reached you – now…here you sit, trying to negotiate the simplest lane change to make an impact…


GPS’s analyze and prioritize data contributions


You develop a roadmap every year, you call it your company’s “budget”.  In many ways it is like the “Rand-McNally”, well thought out, achievable, and precise. The day after you publish it, the information begins to move toward irrelevance. Road conditions are constantly changing, unexpected detours, and you must stop to get a true sense of your direction.

Set your GPS


There are many line items you can plan for, based on historical data. But you know there will be unknowns as well. The unexpected repair, the inevitable challenges of staffing, the desire to have the next best thing… and an unpredictable revenue stream.


What if you set your budget on a GPS – so that each detour off the path you’ve laid out for maximum profitability signaled an alert? “You’ve headed off-course” giving your leaders a chance to change direction and arrive at the destination. How would that impact your month? Would you be more likely to follow the GPS’ suggestion to get back on the route?


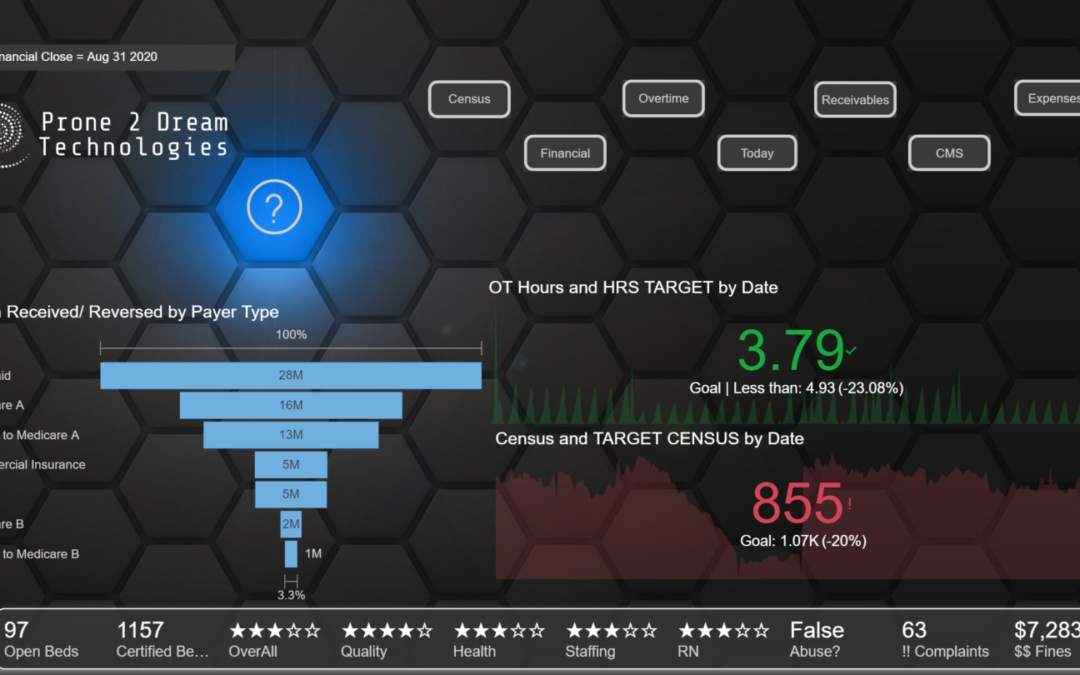
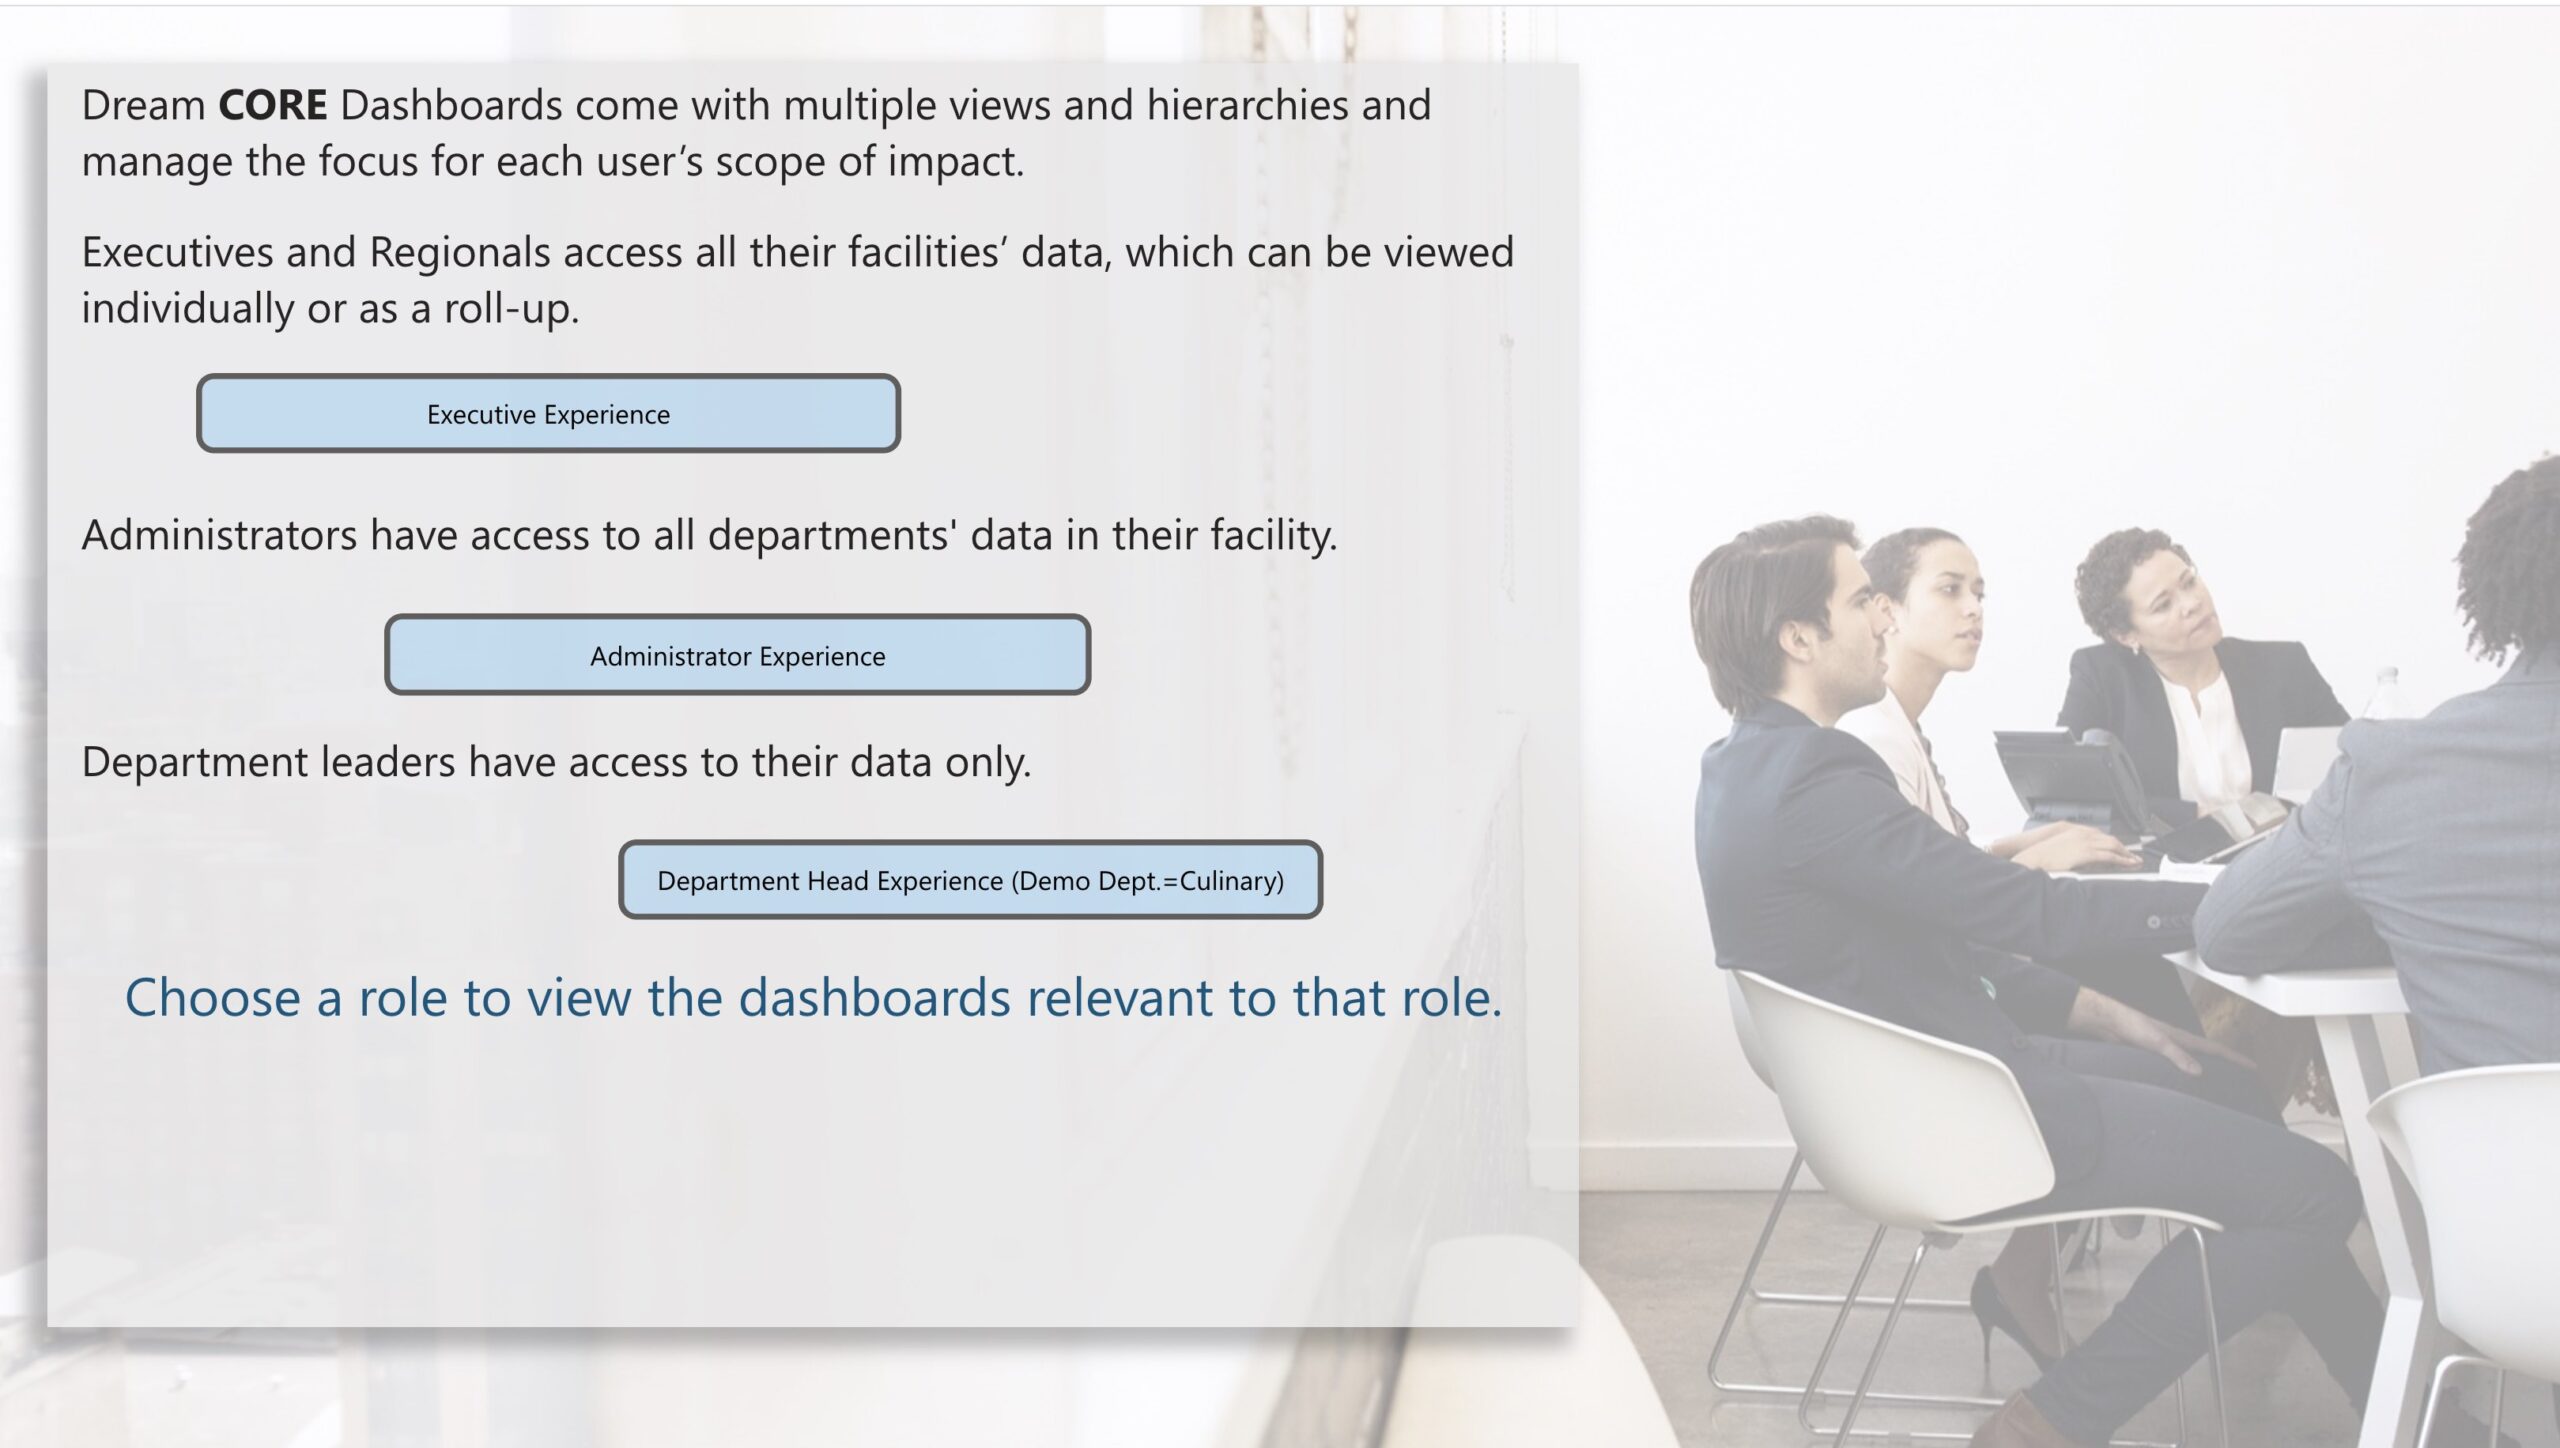
Take a look at DreamCORE Dashboards, a financial GPS solution that reports conditions changes, detours, and the impact that other departments are having on your drive towards maximum profitability.

Recalculating

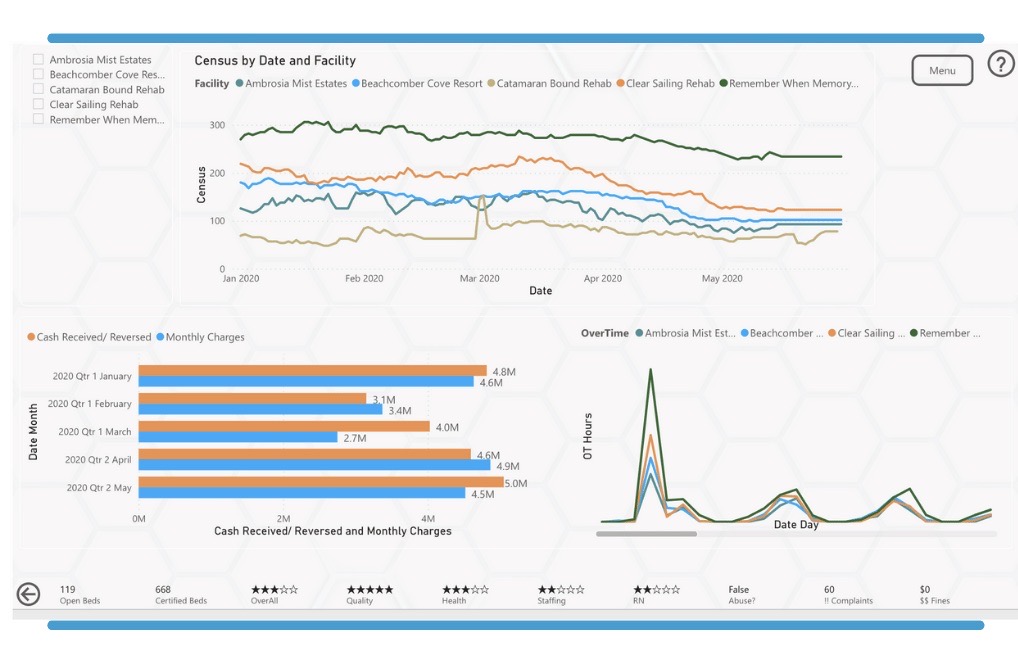
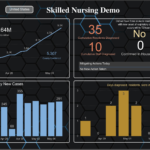
Revenue not trending the way you expected? DreamCORE integrates your revenue sources and expenses and will auto-adjust your budgets accordingly. How much time and money would this save you? Without this auto-adjusting GPS, you’re waiting for EOM reports, as day after day passes and your spending continues, unmindful. You’re taking the scenic route and buying souvenirs, instead of heading purposefully toward your goal.


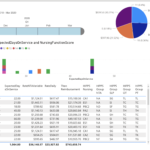
Take a skilled nursing facility, with a potential of 100 clients (residents, patients) per day. There are a mix of payers, depending on insurance scenarios, and billing is complex. Yet, the operator can project these reimbursements with DreamCORE and set the goal (GPS) to reach the maximum amount.


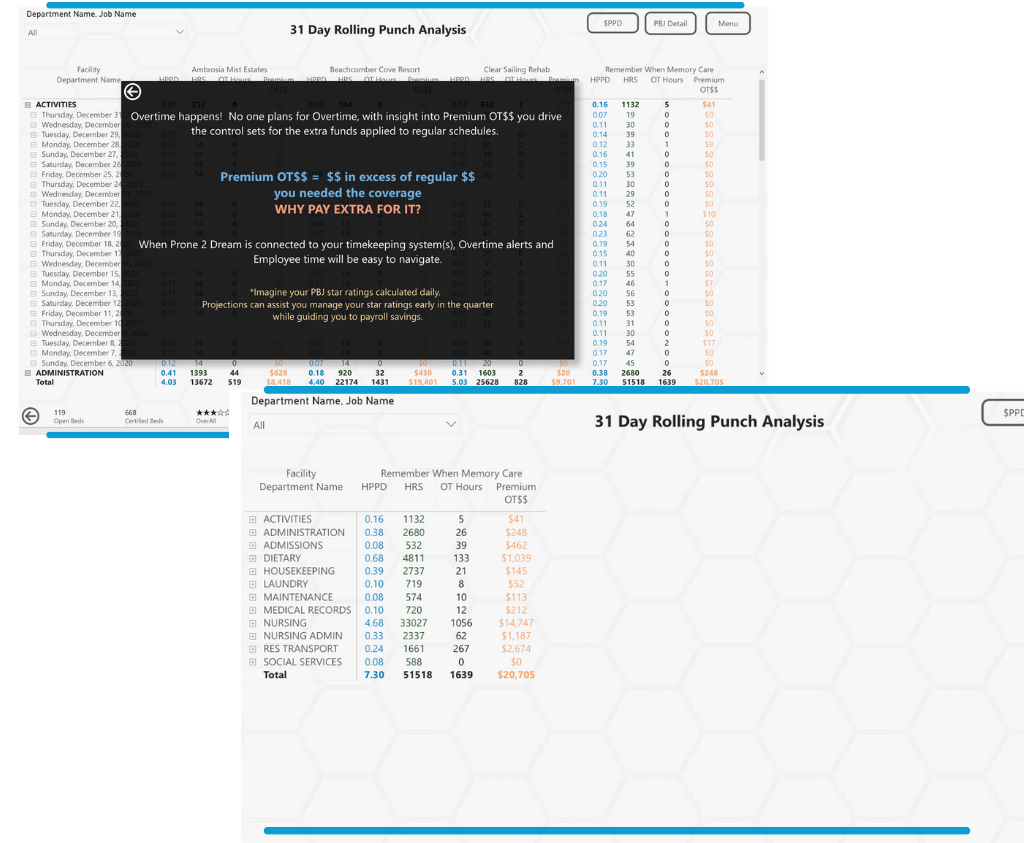
The expenses are variable, too. A certain level of staffing is needed to care for 100 patients, of varying skill sets and pay rates from CNA to RN. In addition, CMS regulations must be met to achieve a star rating that will offer the best perception of the home and its reputation. Staffing is always a challenge … and Overtime Happens! The GPS issues an alert to avoid this drain of premium dollars and to change the schedule before it’s too late.


In addition, these clients must receive a sustainable diet, 3 meals a day plus extras. A healthy diet includes many perishable items, so the coordination of numbers of clients and ordering of supplies is a critical projection, but easily managed by the GPS.

financial dashboards - role-based security


Communication and a Team Approach


Looking at each department and how it contributes to the destination needs to be a streamlined communication process. Consider the communication advantages of each department, being able to see what’s happening in the others.


Much like many drivers on the road contributing to a GPS app, an “accident” ahead, such as an unexpected capital expense (the vehicle breaks down on the trip, needs repair and the GPS recalculates), is visible to everyone on the same journey. They’re all working towards the common goal (meeting the projected outcome = bonuses) so adjusting their own spending to benefit the greater good becomes a team approach.


Without the GPS, there’s a communications gap. For example, your Activities director is unaware of the major unexpected expense in Maintenance, so she continues to spend. GPS calculates for the facility success, with the contributions of all departments as baseline.


This example can be applied to any company – you have revenue, which fluctuates. You have expenses, which are also variable. You have a team of leaders, all trying to do their best to contribute to the success of the whole, all responsible and accountable for the expenses their department incurs.


The next time you hop in your car, whether you’re driving 2 miles or 20 or 200, set your GPS and consider its role. You set the destination, and it offers the most direct route (as well as the scenic route). It alerts you to heavy traffic, accidents, and construction (unforeseen obstacles) and provides an estimated time for your journey (results of your choices).


Would having a GPS for operating your company make a difference in your bottom line?


Book a live demo – Grab a spot on our calendar here.

Hope and Analytics – The New Next

Hope and Analytics – The New Next

There’s a collective sigh of relief throughout the skilled nursing industry as the COVID-19 vaccine is now being distributed. The vaccine provides hope that we’re turning the corner and will start to see a significant decline in the spread of this devastating disease.


In a recent article in Senior Housing News, industry leaders are taking a stand of positivity for the future. Though the census reductions have been significant, SNF leaders know that to truly recover, a wait and see attitude is not going to win. The winners will be those leaning into disruption.


Now, more than ever, is the time to discover innovative technology that streamlines your data platforms and analytics to identify the areas where you can divert dissipation back to profitability.


You use various software’s to run your business and each provides a dynamic look at the insights of using that platform. However, what you really need is a way to see how those software’s work together to benefit your company’s overall financial picture. Imagine an integration of your data silos – producing real time metrics that allow you to adjust operations… long before EOM reports are produced.


Integrated Data Silos


You can have that and more with CORE, our business intelligence solution that turns information overload into business opportunity.


Prone 2 Dream Technologies developed the CORE model for the skilled nursing industry, one of the hardest hit industries of the past year. CORE stands for the core controllables in a business – Census, Overtime, Receivables, Expenses. While the model was built for skilled nursing, it is adaptable to any industry – simply replace the word “census” with “customers” or “clients” to consider your revenue source.


CORE gives you the ability to drill down into these four controllable areas to identify critical issues and see where cash can be diverted back to the bottom line or reinvested in another department, before it’s too late.


Analytics ensures that all the dollars on the table are capitalized on. For example, if cash is dissipating through the culinary department, we can identify that issue with analytics. We can reroute those funds to payroll – to support an additional CNA on the floor or give the RN back the time she must spend scheduling because she’s understaffed. Identifying where you’re leaving money on the table allows you to turn around and reinvest it in the company.


Premium Overtime Dollar


Global P&L in Real Time


In addition to a drill down look at the controllables, CORE provides the global Profit & Loss view. You have the ability to see in near real time the total of all your units, each unit individually, or even a comparative view of selected units. Having a daily data story gives you speed, eliminating the need to wait for month-end reports before taking decisive action.


What would it be like for you to have a daily data story, with near real time accuracy? It means speed and improved profitability – the speed to identify critical issues and course-correct without losing 10, 20, 30, even 45 days waiting for EOM reports, which can mean the difference between profit and loss.


Global P&L View


Want to take a closer look at how CORE can improve your profitability?

To discuss how Prone 2 Dream Technologies can customize CORE for your company, please contact us for a complimentary consultation.


How to Use Predictive Analytics to Improve Skilled Nursing Profitability

How to Use Predictive Analytics to Improve Skilled Nursing Profitability

While predictive analytics strategy is imperative for all industries, skilled nursing has been impacted by Covid-19 to a dramatic degree. The exposure to analytics and the power to aggregate and analyze data in contact tracing, incident reporting, and statistical monitoring has delivered a new normal for the industry.  Yet, the wealth of data already being generated throughout healthcare has never been leveraged to serve nursing homes for better operational efficiency. 

What is “Predictive Analytics”? 

Predictive analytics is the power to assemble data in a relevant way so that it tells a historical story, and based on that story and its continuing trends, can predict outcomes.   

Integrating data silos combines data from different platforms and indicates business issues and business opportunities.  

Take the case of a dietary manager in a skilled nursing facility. His top skills may be culinary mastery and managing a team of people. He’s given the tools to order his supplies – food, cleaning, disposables, etc. He’s given a budget based on expected census(in many cases this can be a flat dollar amount that was projected nearly 6 months ago by the financial division)Coupled with multiple other platforms to manage his staffing needsrecipes, dietary guidelinesetc., he can become quite overwhelmed with the systems and may struggle with how to fit it all together for success. 

A simple strategy to predict outcomes based on departmental data – employees, purchases, and the residents – empowers department managers to “control the controllable.  

Bringing all of his disparate data together with a business intelligence strategy will give him back control of the department’s success.  Simply delivering an auto-adjusted budget based on the facility’s actual census as it fluctuates throughout the month, coupled with a declining budget, he will be able to discern his direction and feel empowered to meet the goals.  Why is this important? If census goes down, he is delivered the adjusted budget dollars and declining balance for purchases through the month ensuring expenses are controlled. Likewise, if census increases, adjusted budget dollars increase, and orders adjusted for enough supplies to be certain he is taking excellent care of his customers.  Without predictive analytics, his orders may be “his best guess” on needs and may fall short of budget expectations and stress his departments commitment to excellence 

Employing this simple business intelligence strategy across all of your department heads will empower the facility to meet budget expectations.   

All of your Department Managers want to succeed. With predictive analytics, auto adjusting budget dollars and “declining balance” can give them confidence to meet spending expectations.   

What else can predictive analytics be used for? 

Skilled nursing operators have a wealth of data that can be used to make course adjustments and get back on track to reach goals.  Data gives you a historical view of “what happened” and “what’s happening right now”.  

Predictive analytics identifies trends, alerts for problems, and offers opportunities to put data to use and strengthen favorable outcomes. 

Our predictive analytics strategies can be applied to PBJ, census, cash flow, and accounts receivableand many more. 

Making sense of too much data  

How many software platforms does it take to run a skilled nursing facility? Census/EHR, Payroll, Scheduling & PBJ, Culinary, Financial, … the list goes on. The result? Information overload. Yet, smart operators are taking these data silos and integrating them for their best benefit. By doing so, they are turning information overload into business opportunity.  Prone 2 Dream Technologies has developed CORE – a business intelligence strategy that joins together your disparate data silos into a relevant order. Your data aggregated in one place custom dashboards – where you have real time access to all the factors affecting your profitability.   COREgives you the ability to view fresh data on a daily basis – you can drill down into your daily activities and find the insights you need for actionable decisions – in minutes. You are able to monitor controllable expenses before they affect your bottom line.   With CORE, you have the visibility to evaluate the course, identify direct influencers and evaluate course corrections as the data builds bringing stability to your profit margin.  

How to apply a predictive analytics strategy  

The key is consultation with our seasoned analyst who can assess your data stores – The why? The how did we get here? The what needs to change for us to reach our goal?    Once your history has been evaluated and the goals identified, Prone 2 Dream Technologies can apply a predictive analytics strategy over that data. This includes integrating your data platforms into a centralized location, keeping them refreshed, where critical KPIs can be at your fingertips.   Sound complicated? It’s not.   

Prone 2 Dream sets you up for success with onboarding, ongoing training and unlimited support for your executive team and front-line managers.  

Contact us today for your complimentary consultation. 

error: Content is protected !!