Your Daily Data Story… the Pulse of Your P&L

Your Daily Data Story… the Pulse of Your P&L

What would it mean to your organization to have the pulse of your P&L available to you every morning? Imagine, instead of shuffling multiple reports or clicking through multiple browser screens, one dashboard with the ability to drill down on red flag anomalies highlighted by daily green data.

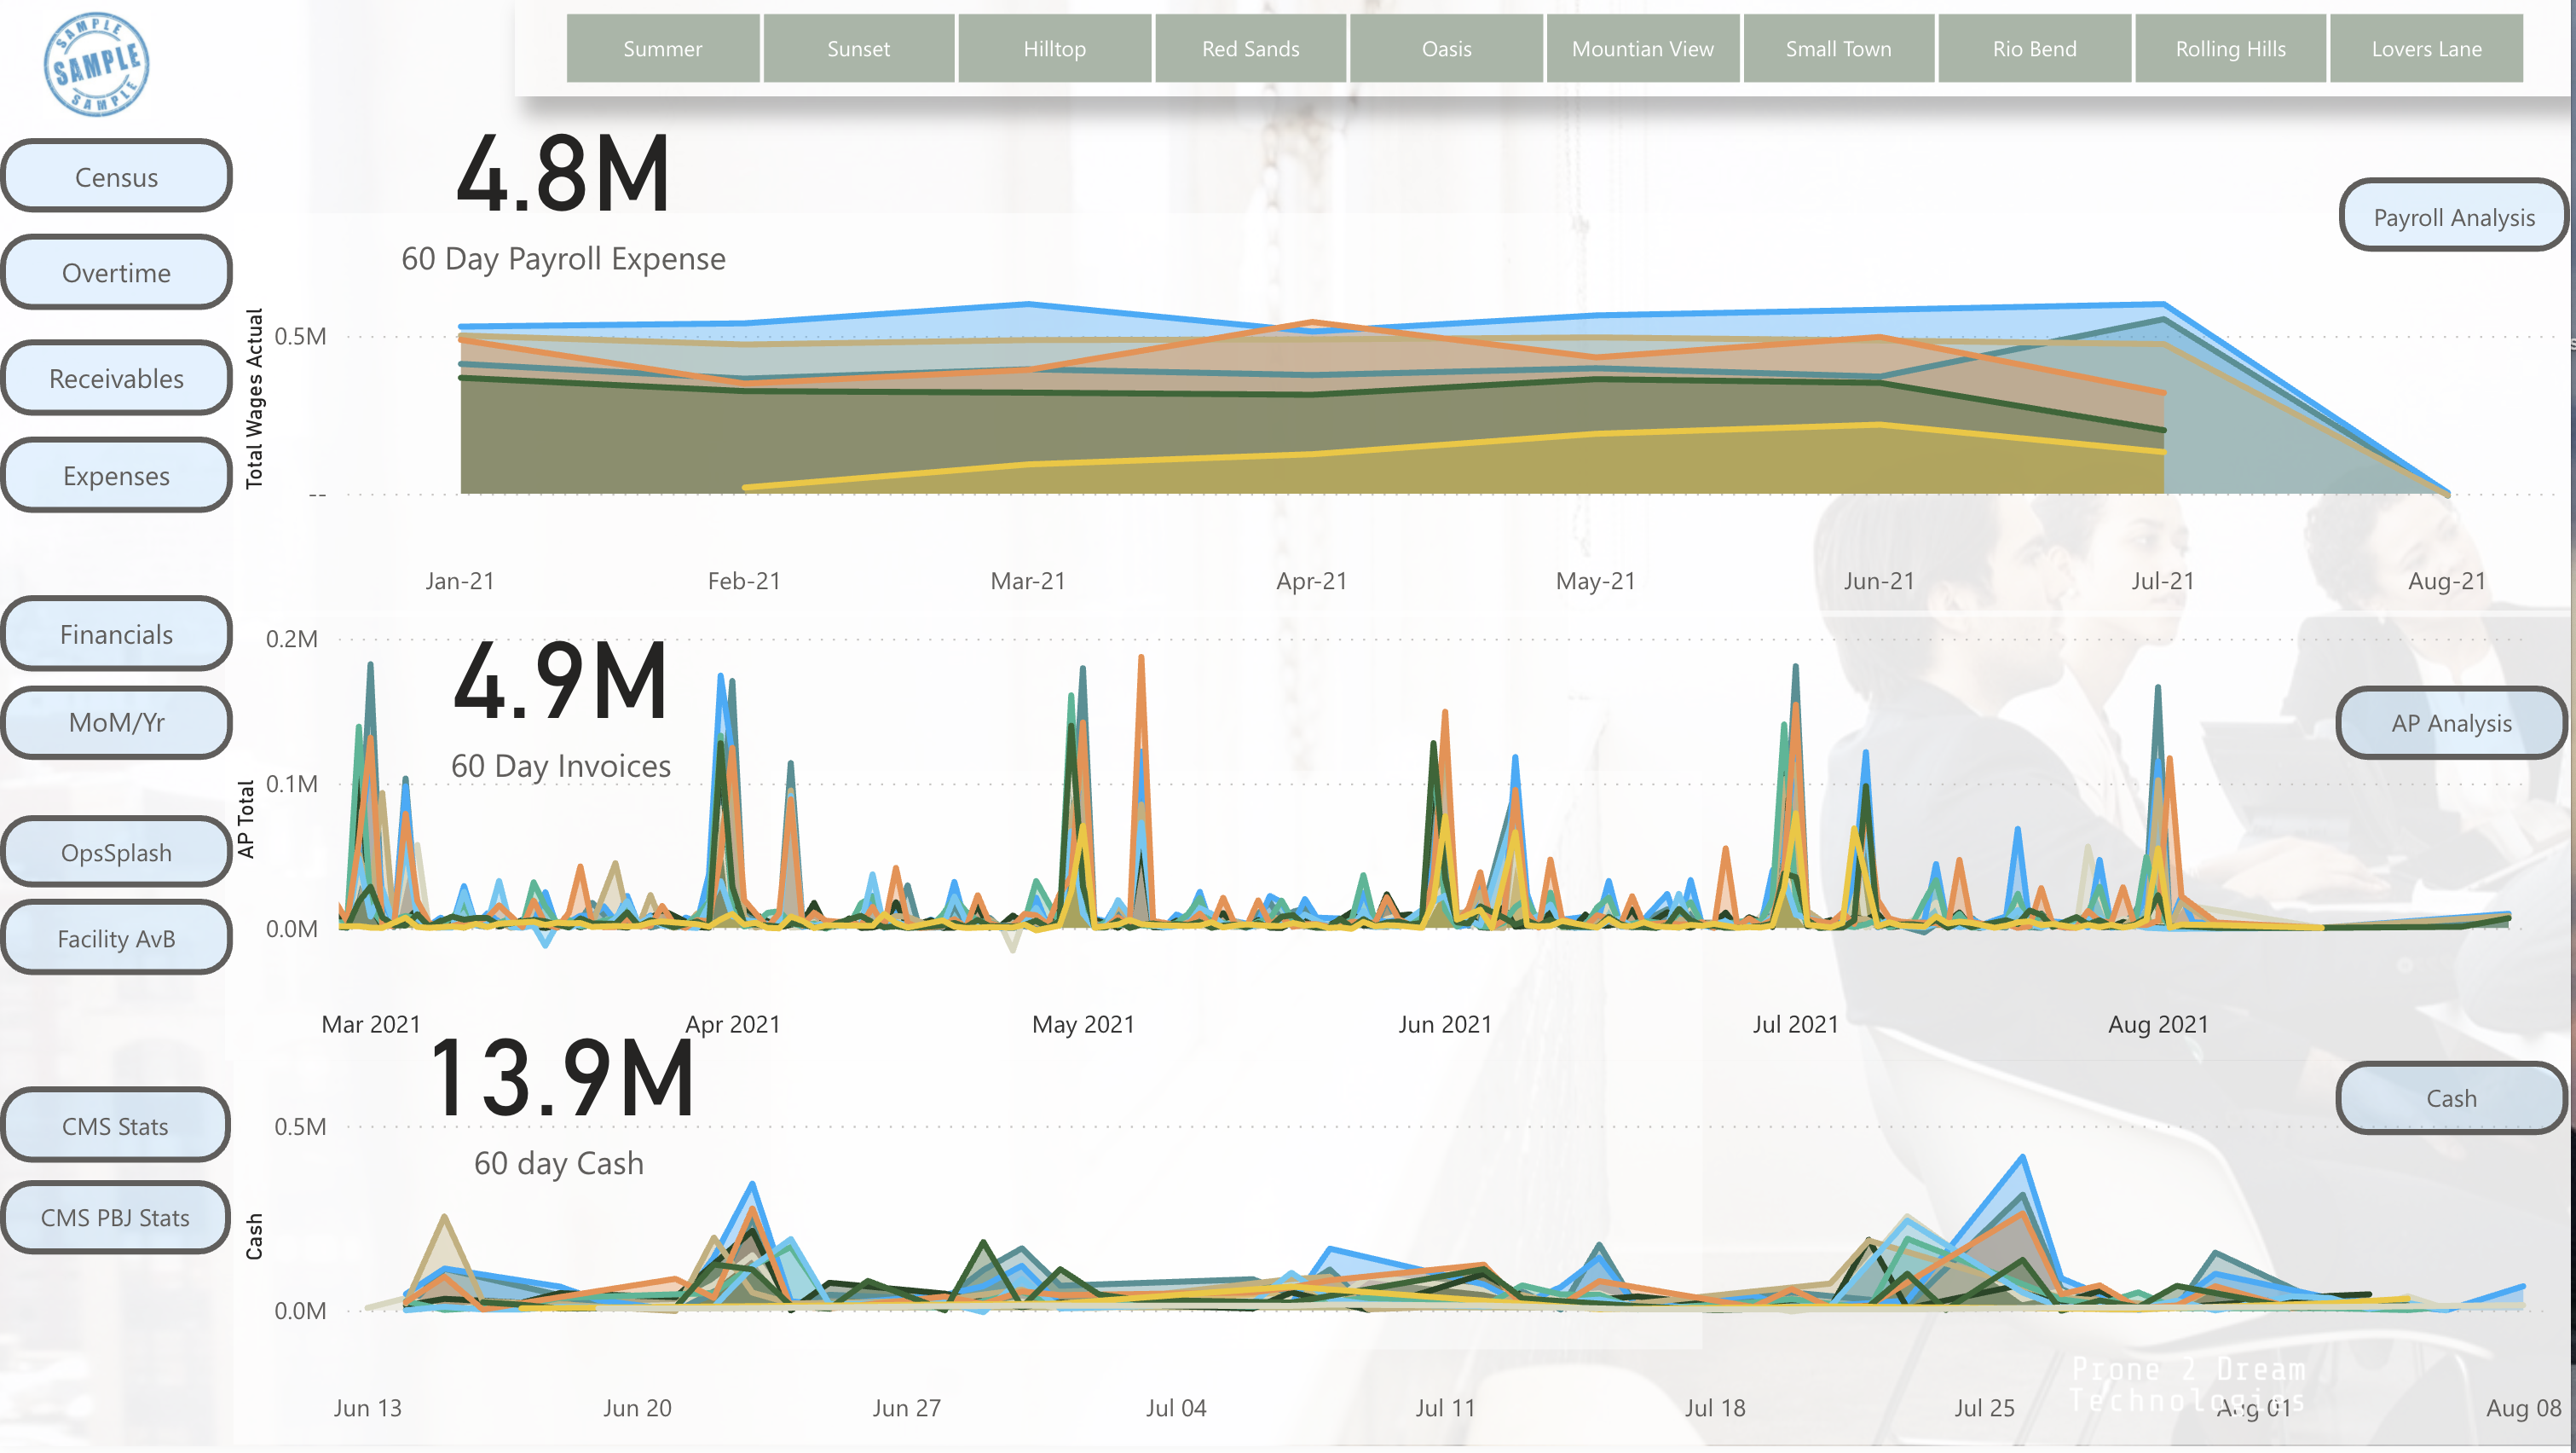
One-Stop-Shop of Cash Position


DreamCORE Dashboards sort data from your book of record, EHR, and timeclock/payroll system into logical, relevant views every day.

Using real time data enables evidence-based decisions – you can provide clear direction to your teams for growth and improvements.

A daily data story enables confident reports to stakeholders, without any of the heavy lifting of creating custom reports – the pulse of your P&L is available to you every morning, at a glance, with your coffee. Consider the ease of discussions around profitability.

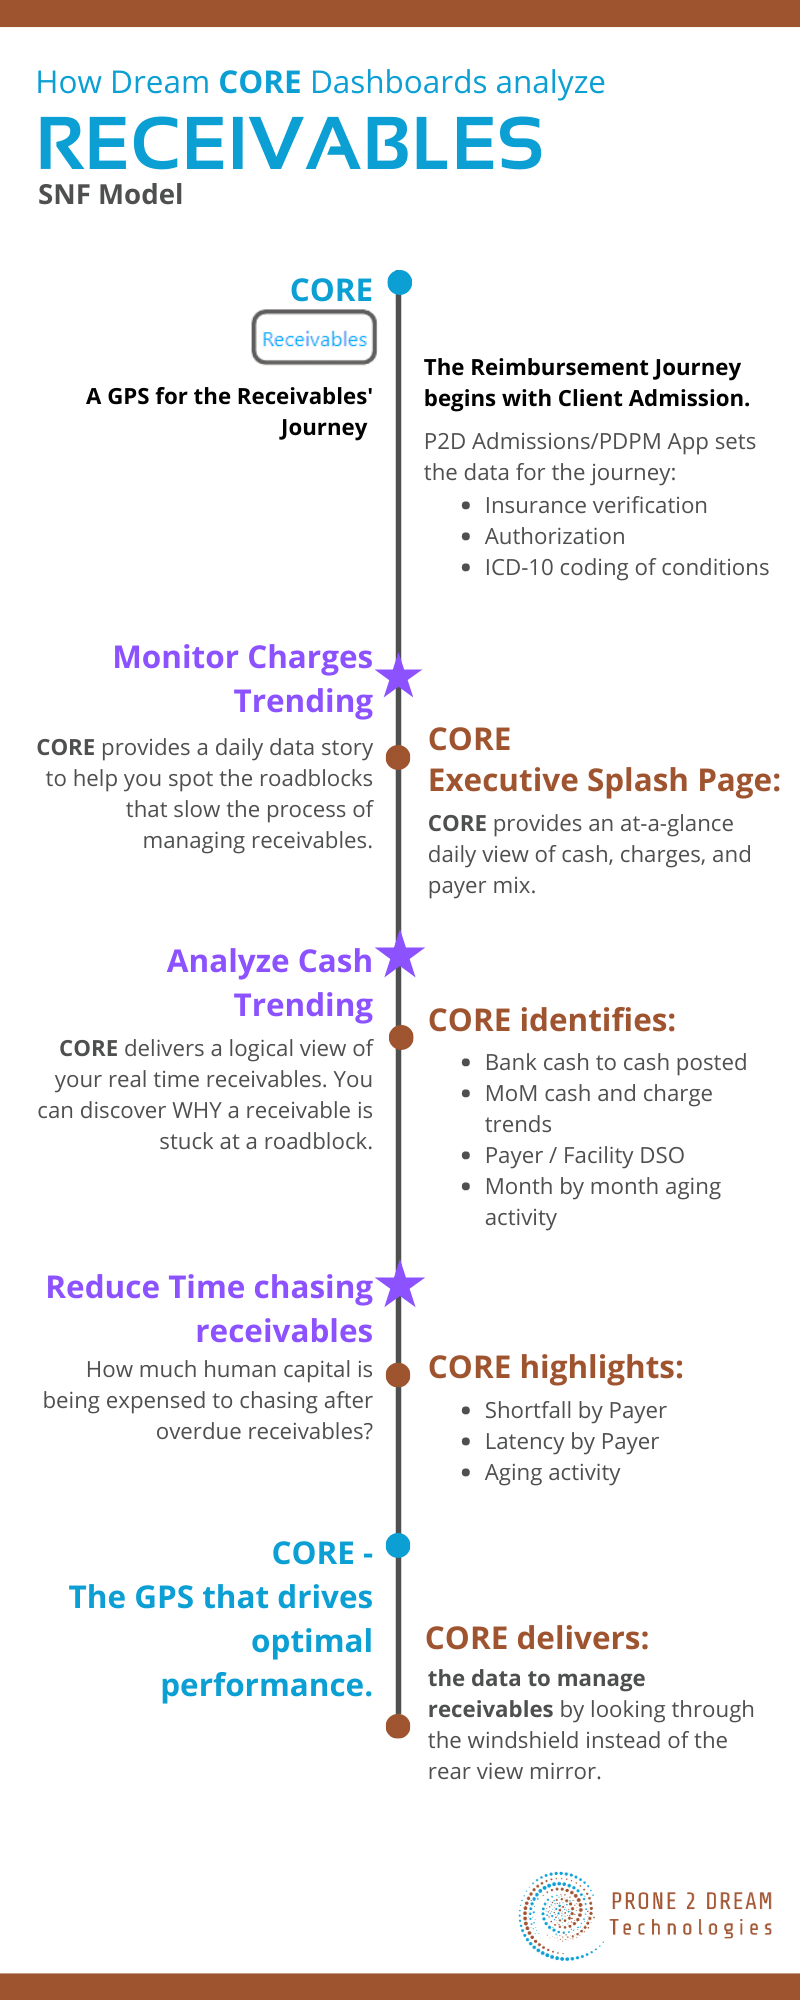
Drill Down into Cash Position


With the click of a button, you have your daily cash analytics – daily deposits, trend by month, by roll up, or by individual facility – this is a bird’s eye view of where you stand today, relative to payroll or other large expenses.

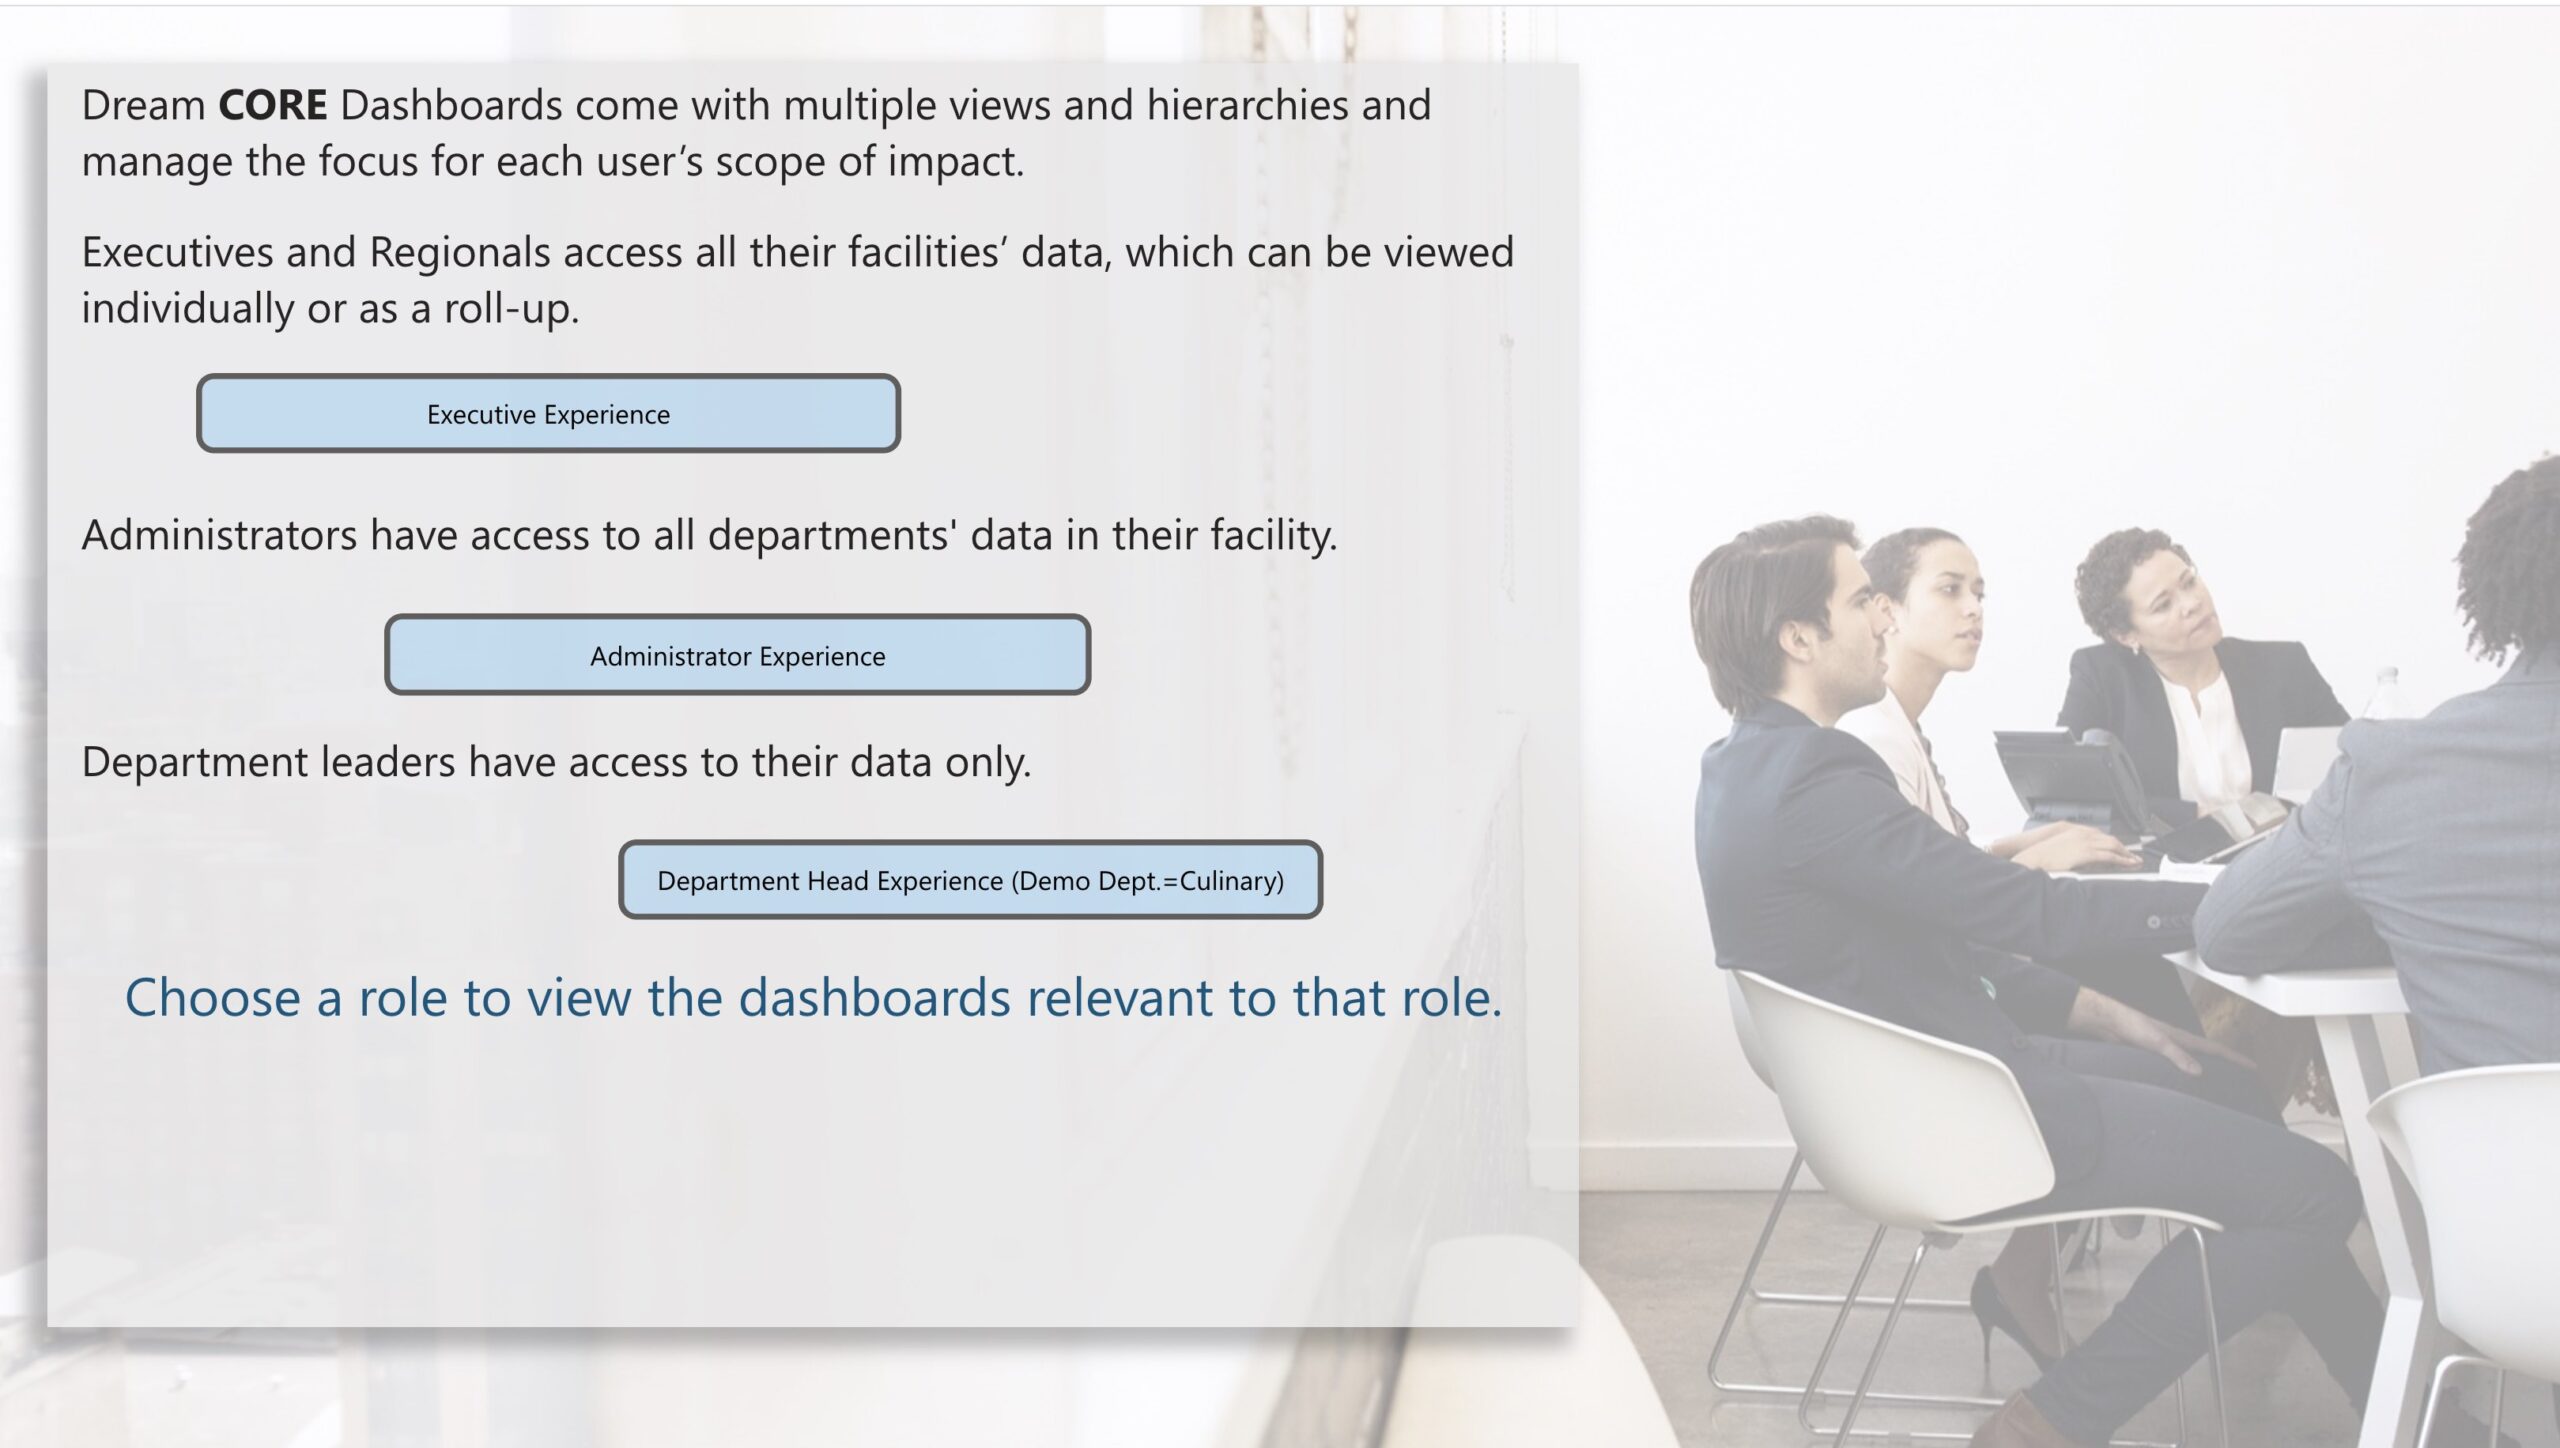
With daily green data, you have one version of the truth. Executive leadership sees the comprehensive view of the organization. Our role-based security protocols keep high level analytics protected. You’re able to share appropriate information with investors, REITs, and stakeholders. And, you can share different, yet appropriate information with your senior leaders. All viewers are seeing the green data, updated daily, one version of the truth, yet the screens that are only relevant to their role in the company.

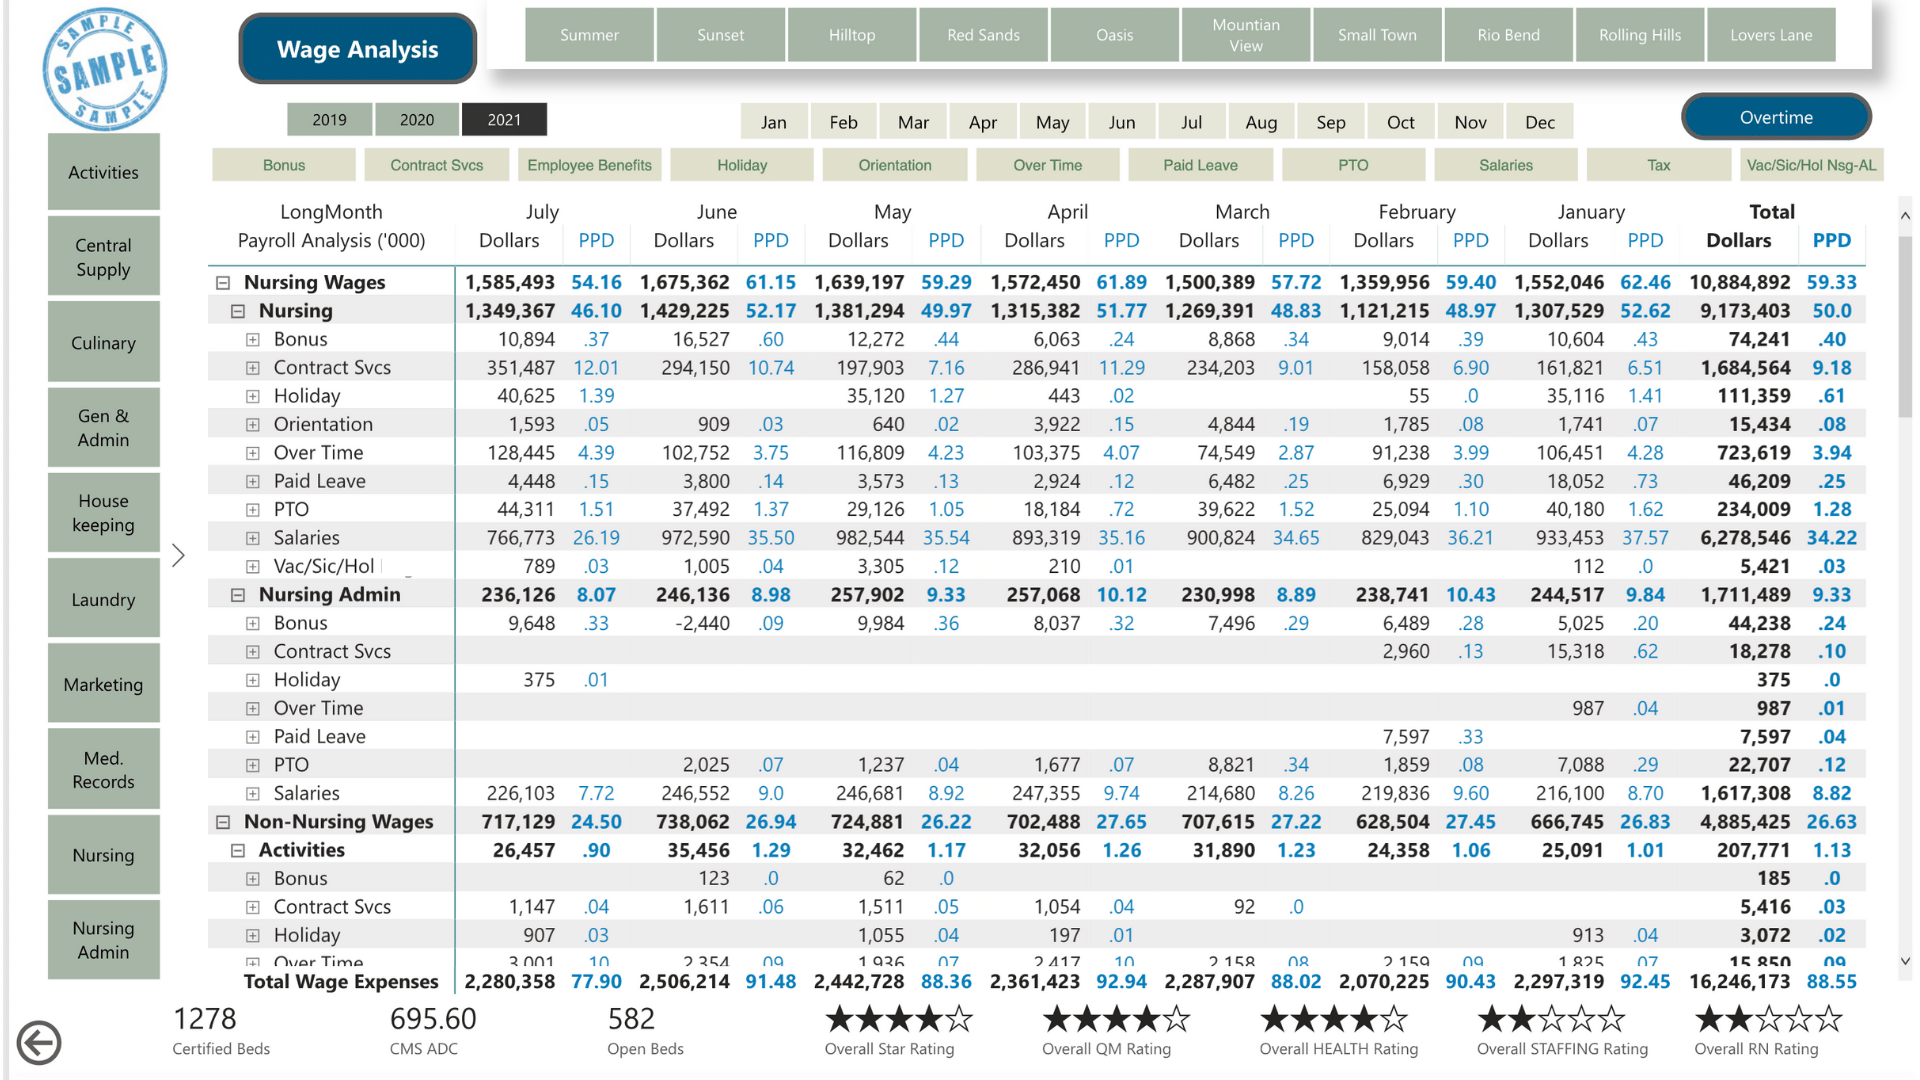
Payroll Analysis picks up GL code to display daily PPD and dollars PPD


Your comprehensive dashboard is flexible for you to “lock down” to specific views. DreamCORE Dashboards have been designed to enable SNF companies to transform data overload into relevant views. Remove the clutter to drill down into any specific facility, department, even employee timecard – to give you perspective on true action needed. You can confidently make evidence-based decisions.

Having a daily pulse on payroll enables the ability to manage overtime, improve CMS star ratings, improve contractual agreements, and serve your clients to the best possible outcomes.

A facility DON typically doesn’t have an MBA. Nor do your other facility department leaders. Yet, each one is expected to contribute to the profitability of the company. With DreamCORE Dashboards, you equip your regionals and administrators with the mentoring tool so each can manage their department’s numbers to success.

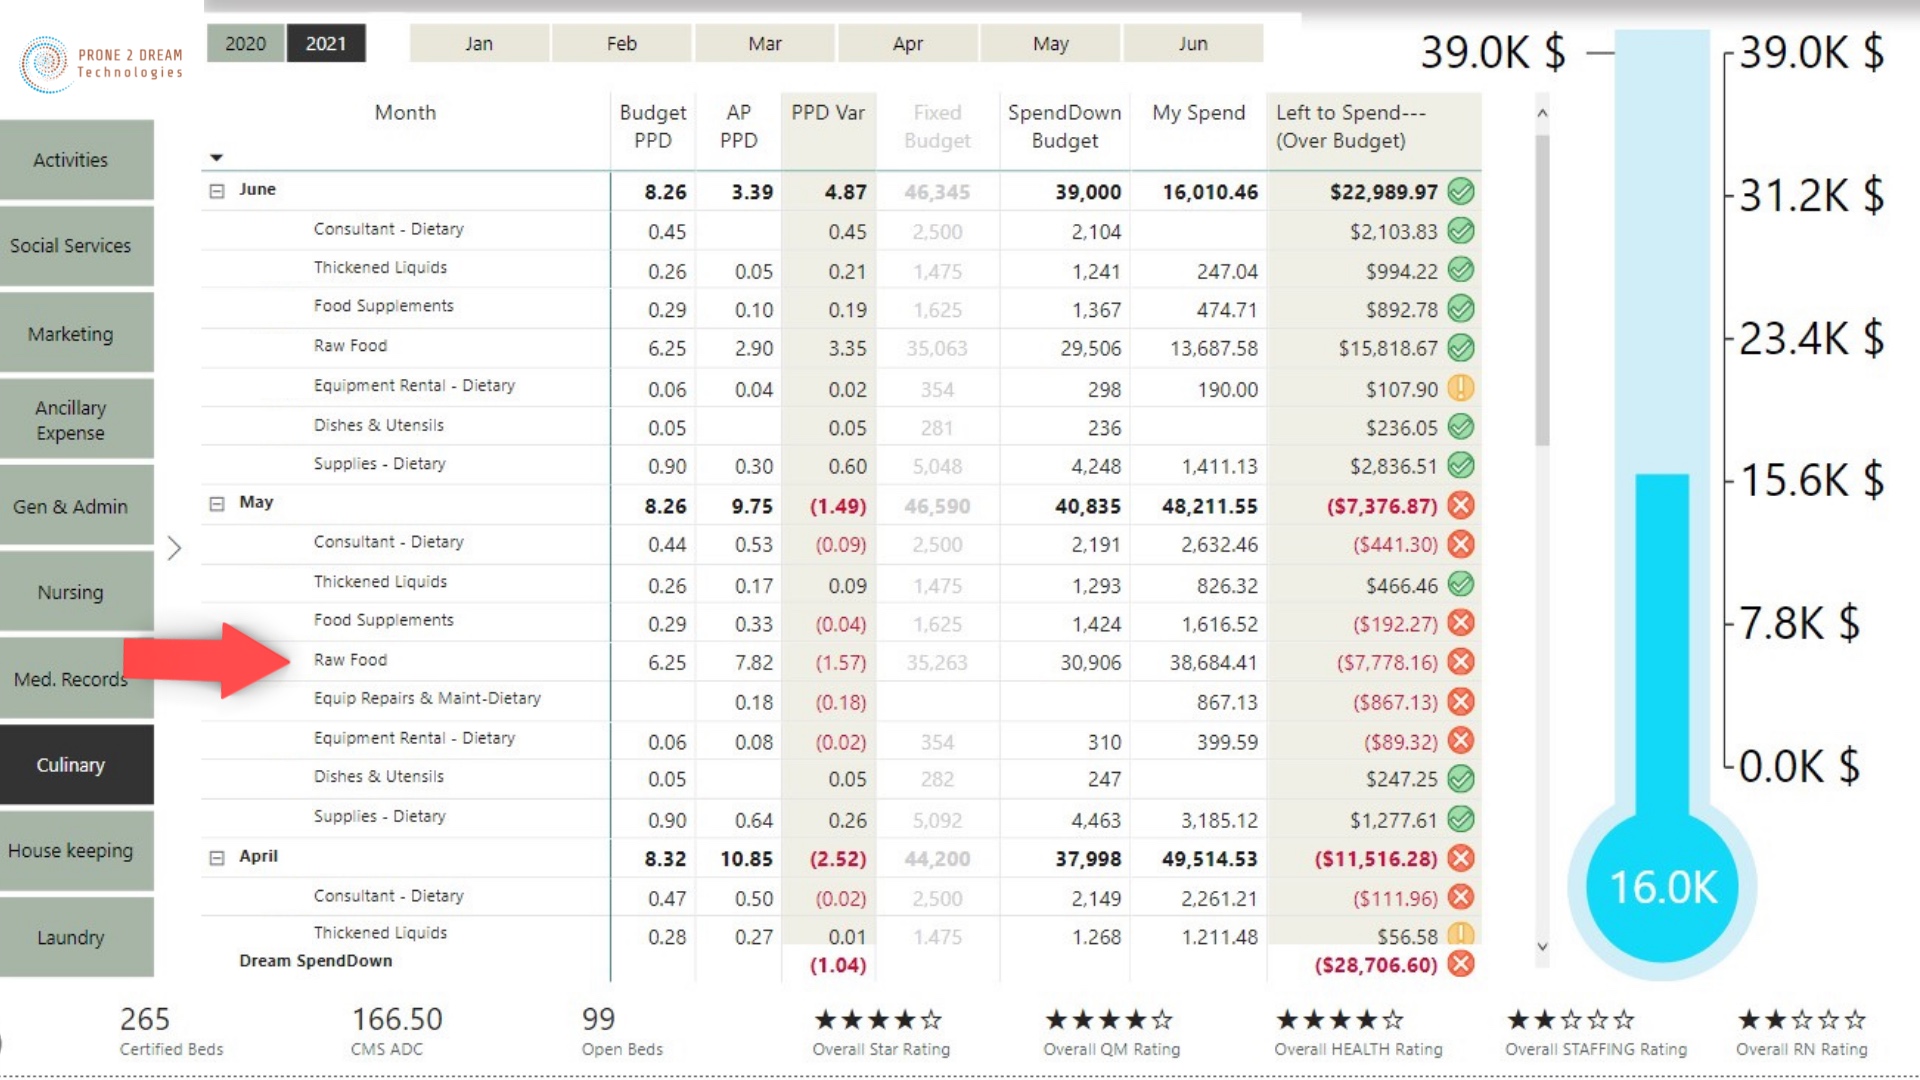
A Daily View of Spending


DreamCORE Financial Dashboards - Daily Data Story - Budget


DreamCORE Dashboards adjust the budget daily based on current census. You have true PPD according to true census, and can drill down by month, facility, and department. With this budget scaling, your regional directors can assist facility leaders to understand and successfully drive toward corporate goals.

Your EBITDA metrics are also calculated, showing your overall daily operating performance. This is an accurate view for investors and other stakeholders.

3 “Reporting Only” Logins and You’re 7 Days Away From Powerful Analytics


While DreamCORE Dashboards are a complex compilation of your critical KPIs, they couldn’t be easier for you to attain and use. Prone 2 Dream Technologies does all the heavy lifting. Deliver us three reporting-only logins and we’ll deliver your dashboards in 7 days. You will have single sign on access with your existing Microsoft account. As Microsoft partners, we host your data in our secure portal, and you can simply open a browser window to view it.

Want to start reading your daily data story? Book a live demo today.


SNF Operators – Reduce Time Chasing Receivables

SNF Operators – Reduce Time Chasing Receivables

How much of your human capital is being expensed to chasing receivables?


With DreamCORE Dashboards, you have a daily data story showing cash trending and charges trending, shortfall by payer and much more. It’s an at-a-glance daily view of your cash flow status.


When a new patient is admitted, critical data enters the EHR. DreamCORE Dashboards integrate the EHR with your book of record to deliver a logical view of real time receivables.


Having a daily view helps you identify roadblocks that cause receivables to enter the aging status … where they are less likely to be realized. Dream CORE displays historical data to measure trends and provide insight for improvement.


Check out the benefits on the infographic below.

Book a live demo – Grab a spot on our calendar here.


SNF Operators – How to Manage HPPD

SNF Operators – How to Manage HPPD

SNF Operators can streamline their workflow and better manage their HPPD by using DreamCORE Intelligence Center, a tool that integrates the company time clock with its EHR and financial book of record. Prone 2 Dream’s innovative technology provides the critical data to meet both regulatory and financial obligations, within a user-friendly interface.

Role-Based Security ensures that all sensitive employee information remains restricted and users can only see data relevant to their role. This helps nursing schedulers make informed decisions using both historical data and predictive analytics, allowing them avoid paying Premium Overtime – the dollars in excess of payroll budgets.

DreamCORE’s single sign-on platform provides:

  • Overtime analysis
  • Bonus analysis
  • Agency analysis
  • A clear, current view of HPPD, including agency
  • A rolling punch analysis
  • A drill down to individuals on the time clock right now

Integrating these data sets also enables SNF Operators to manage their CMS staffing rating. DreamCORE provides a simple formula that projects the next quarter’s rating, and a desired rating can be achieved by managing the HPPD.

Overtime is just one of the controllables within a SNF’s financial management system. With DreamCORE (Census, Overtime, Receivable, Expenses) SNF operators can identify opportunities to make a financial impact on their bottom line, without waiting for end-of-month reporting.

Worth a look?

Book a live demo – Grab a spot on our calendar here.


Revenue and Roadblocks: Right Now on the Right Route

Revenue and Roadblocks: Right Now on the Right Route

You use many software platforms to run your business, and each offers a dynamic set of metrics.


What if you had a way to see how those metrics affect each other? A way to align them – showing the best route to your destination (profitability) and alert you to roadblocks in your path?


In our last article, Business Detours? Not A Problem When You Set Your GPS, we described how business intelligence and predictive analytics form a GPS to help frontline managers navigate the financial side of your company.


Enter a GPS solution called DreamCORE Dashboards – CORE is an acronym for the controllable parts of your business: Census* | Overtime | Receivables | Expenses.

*This model was built for the skilled nursing industry but is applicable anywhere –C is your Customers or Clients, your revenue source.


Let’s take a closer look at Census, and how you can use this fluctuating element to improve both customer satisfaction and your profitability.


Census – The Lives We Care For


Census is the lives we care for within our skilled nursing facilities. Our clinical teams treat and care for the individuals entrusted to us, ensuring the right solutions to help heal in the best way, in the best atmosphere.


Financially, census drives the revenue. We need to capitalize on every dollar of revenue to support the mission of care – nursing supplies, dietary sustenance, entertainment, housekeeping, administration.


The industry has worked out multiple algorithms to ensure the best journey of the revenue dollar to the table– through a labyrinth of documentation, carve outs, comorbidities coding, and specifications that vary widely by payers.


What success have we had managing “the dollars on the table”?


Managing Expenses against Fluctuating Revenue


Staying true to the GPS theme, finance develops a roadmap yearly, the “budget”. It is well thought out, achievable, and precise. The day after it is published, the path to success begins to deteriorate. Road conditions are constantly changing (lower than expected census), unexpected detours (transmission on your van konks out), inevitably you must stop, take time to get a true sense of where you are on the map, and recalculate your path to the destination.


DreamCORE is constantly recalculating to support your goals – by providing you the pinpoint on the map of where you are at any given time, and where you need to go to stay on course to your destination.


For example, your dietary manager was budgeted $35,263 for Raw Food for May–pinned to his corkboard–this budget was calculated last October and was based on a census budget of $8.26 PPD. The actual census for May is averaging $9.75 PPD. If the dietary manager spends the original budget of $35,263, DreamCORE gives clear sight to the overspend of $7,778. The thermometer shows current spend against scaled budget – making it much easier to adjust spending to meet current census level.


A significant ROI of DreamCORE is based in the automatic adjustment of the budgets.


In the example above, the dietary manager’s expense dashboard would show the budget for his department is $26.747.  And daily the “Expected Budget” would be adjusted by the Average Daily Census in the background.  Additionally, with each invoice entered into DreamCORE, the budget balance would be reduced, like a checkbook, keeping the whole department informed of their current balance, helping them not to “overdraw” the account.


So being able to see the financial picture at a quick glance enables small changes, which over time make a big impact.


This automation keeps the patient at the center – each operational department is rotating around the patient, spending what is necessary to create the healing experience. Your teams are working with their patients, not sitting at desks looking at numbers. They’re solving people problems to create the best customer experience.


On the Journey to success


Consider you’re on the road to your destination and your GPS tells you there’s an accident ahead, you should exit now to the alternate route. You choose to disregard GPS and within a few minutes you’re at a dead standstill. Half an hour later, you pass the accident, but you’ve lost 30 minutes. Even speeding at this point won’t get you to the destination on time. A small change to the alternate route may have made the difference.


DreamCORE provides clear analytics to help you and your teams pinpoint their exact location, adjust for what is ahead, and equipping you to stay on course to the destination.


Getting your people to love their numbers

Road to Success

What if each of your department leaders were taught how to use a financial GPS to make the right decisions for their department?


Look at the flip side: “You don’t know what you don’t know”–When they don’t understand where they are or where to go, they’re on a path to fail. Nobody hires on to fail! They want to do well – to succeed at their jobs means they meet expectations.


DreamCORE encourages camaraderie – when all the departments are working harmoniously, they start to see how they can help each other toward the greater good. One department has an unexpected capital expense, the rest can tighten their belts a bit to balance that out.


As an operator, you want to be competitive. You want to hire the best person to run each of your departments. So you hire a great culinary talent to run dietary, but he’s probably not an MBA. He can easily be taught to read DreamCORE, understand the expectation, and DreamCORE can free his time to be where he needs to be – providing a great customer experience.


Your department leaders know their priority is the best customer experience. When they know where they are financially, they make the best decisions. They’ll make the best decision for the company every time because they want to feel good about their work. They want to succeed. And you know that successful teams reduce turnover and build great culture.


Teaching them how to read a quick DreamCORE view of their department can set them up to succeed, which leads to managing the dollars already on the table.


Give them a clear solution to feed that success.

Book a live demo – Grab a spot on our calendar here.


Business Detours?  Not A Problem When You Set Your GPS

Business Detours? Not A Problem When You Set Your GPS

What if you had a GPS to drive you to maximum profitability?


Why do we like GPS? It not only gives us the best route to our destination, but it also identifies roadblocks in our way. You hear “Accident 12 miles ahead in the right lane, 27-minute delay, exit now to take the alternative route”. The roadblocks are actually reported by other users of the app, and because of their contribution to your journey, you are able to make a timely decision, avoid the pitfall, and arrive on time. Imagine your phone battery was dead on this same trip and this information never reached you – now…here you sit, trying to negotiate the simplest lane change to make an impact…


GPS’s analyze and prioritize data contributions


You develop a roadmap every year, you call it your company’s “budget”.  In many ways it is like the “Rand-McNally”, well thought out, achievable, and precise. The day after you publish it, the information begins to move toward irrelevance. Road conditions are constantly changing, unexpected detours, and you must stop to get a true sense of your direction.

Set your GPS


There are many line items you can plan for, based on historical data. But you know there will be unknowns as well. The unexpected repair, the inevitable challenges of staffing, the desire to have the next best thing… and an unpredictable revenue stream.


What if you set your budget on a GPS – so that each detour off the path you’ve laid out for maximum profitability signaled an alert? “You’ve headed off-course” giving your leaders a chance to change direction and arrive at the destination. How would that impact your month? Would you be more likely to follow the GPS’ suggestion to get back on the route?


Take a look at DreamCORE Dashboards, a financial GPS solution that reports conditions changes, detours, and the impact that other departments are having on your drive towards maximum profitability.

Recalculating

Revenue not trending the way you expected? DreamCORE integrates your revenue sources and expenses and will auto-adjust your budgets accordingly. How much time and money would this save you? Without this auto-adjusting GPS, you’re waiting for EOM reports, as day after day passes and your spending continues, unmindful. You’re taking the scenic route and buying souvenirs, instead of heading purposefully toward your goal.


Take a skilled nursing facility, with a potential of 100 clients (residents, patients) per day. There are a mix of payers, depending on insurance scenarios, and billing is complex. Yet, the operator can project these reimbursements with DreamCORE and set the goal (GPS) to reach the maximum amount.


The expenses are variable, too. A certain level of staffing is needed to care for 100 patients, of varying skill sets and pay rates from CNA to RN. In addition, CMS regulations must be met to achieve a star rating that will offer the best perception of the home and its reputation. Staffing is always a challenge … and Overtime Happens! The GPS issues an alert to avoid this drain of premium dollars and to change the schedule before it’s too late.


In addition, these clients must receive a sustainable diet, 3 meals a day plus extras. A healthy diet includes many perishable items, so the coordination of numbers of clients and ordering of supplies is a critical projection, but easily managed by the GPS.

financial dashboards - role-based security


Communication and a Team Approach


Looking at each department and how it contributes to the destination needs to be a streamlined communication process. Consider the communication advantages of each department, being able to see what’s happening in the others.


Much like many drivers on the road contributing to a GPS app, an “accident” ahead, such as an unexpected capital expense (the vehicle breaks down on the trip, needs repair and the GPS recalculates), is visible to everyone on the same journey. They’re all working towards the common goal (meeting the projected outcome = bonuses) so adjusting their own spending to benefit the greater good becomes a team approach.


Without the GPS, there’s a communications gap. For example, your Activities director is unaware of the major unexpected expense in Maintenance, so she continues to spend. GPS calculates for the facility success, with the contributions of all departments as baseline.


This example can be applied to any company – you have revenue, which fluctuates. You have expenses, which are also variable. You have a team of leaders, all trying to do their best to contribute to the success of the whole, all responsible and accountable for the expenses their department incurs.


The next time you hop in your car, whether you’re driving 2 miles or 20 or 200, set your GPS and consider its role. You set the destination, and it offers the most direct route (as well as the scenic route). It alerts you to heavy traffic, accidents, and construction (unforeseen obstacles) and provides an estimated time for your journey (results of your choices).


Would having a GPS for operating your company make a difference in your bottom line?


Book a live demo – Grab a spot on our calendar here.

error: Content is protected !!